These statistics pdf worksheets for 5th grade give teachers ready-to-print practice across the core data skills students work with at this level — line plots, frequency tables, and measures of center and spread. The set fits naturally into the math block without prep: print a worksheet for morning warm-up, pull one for a targeted small-group session, or assign one for homework with no additional setup required.
The Specific Skills Covered in Each Worksheet
Each worksheet focuses on one clear area of Grade 5 data work. That narrow focus isn't accidental — when students are still building fluency with fractional line plots or learning to distinguish median from mean, mixing too many skills on a single worksheet makes it harder to pinpoint exactly where the confusion lives.
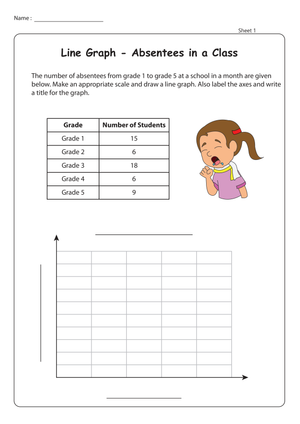
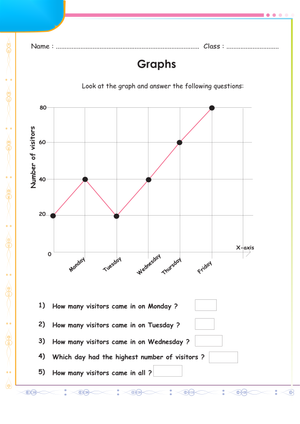
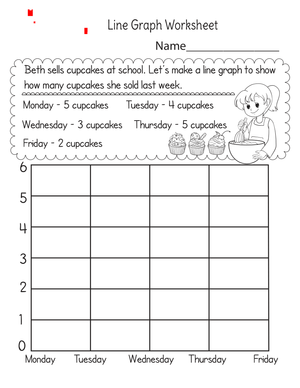
- Whole-number line plots: reading titles, interpreting scale, comparing data points, and answering short reasoning questions tied to the display.
- Fractional line plots: placing measurements in halves, fourths, and eighths on a number line and solving problems from the completed plot.
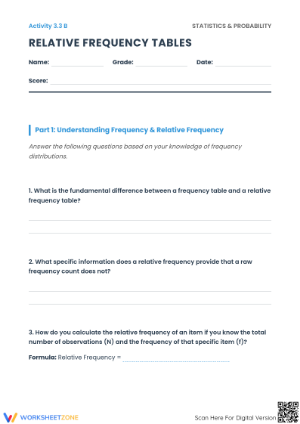
- Frequency tables: organizing raw data before graphing or analyzing, and reading a completed table to answer follow-up questions.
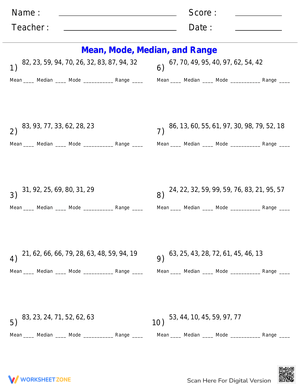
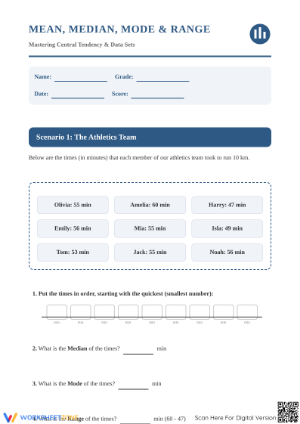
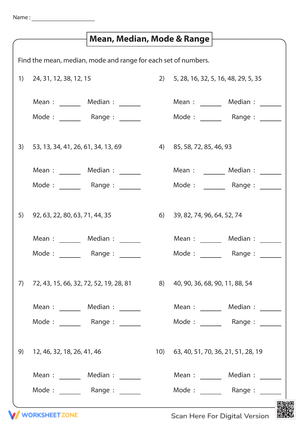
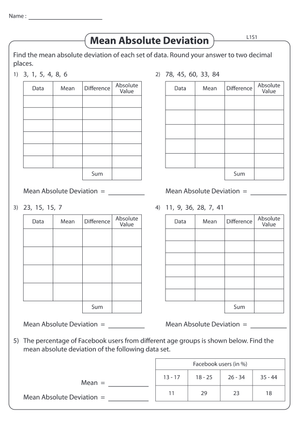
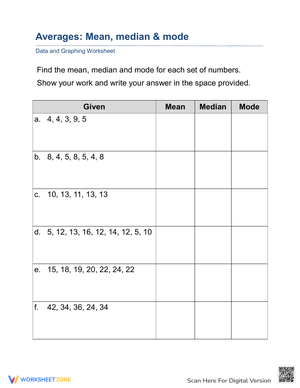
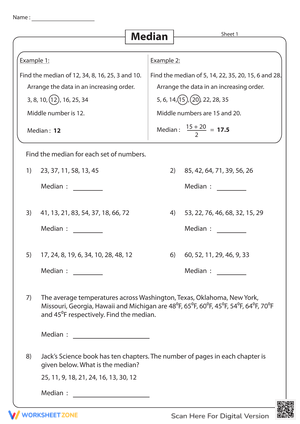
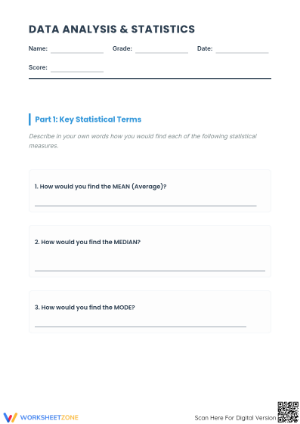
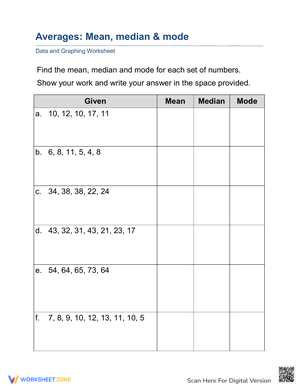
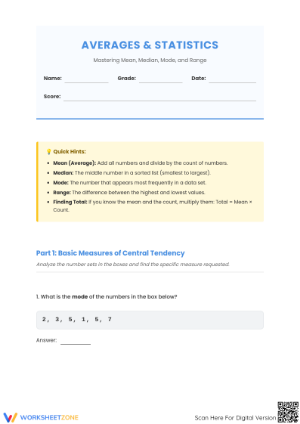
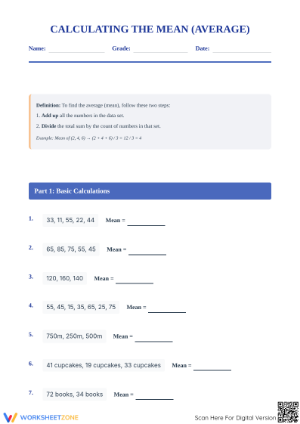
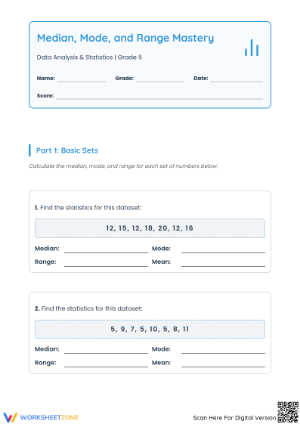
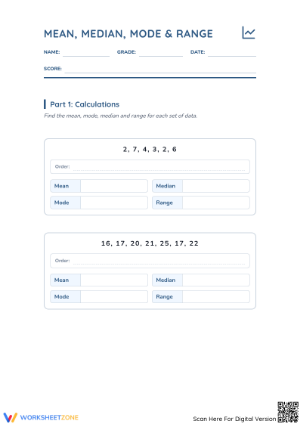
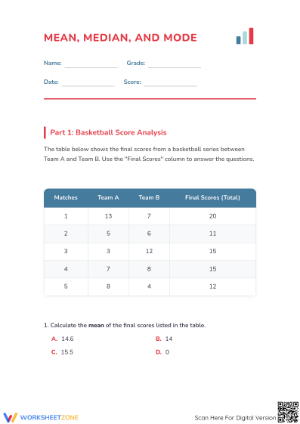
- Mean, median, mode, and range: calculating each measure from a small data set and identifying which one gives the most useful description of the numbers.
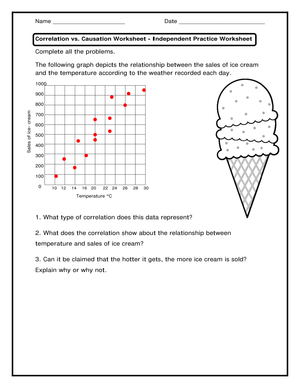
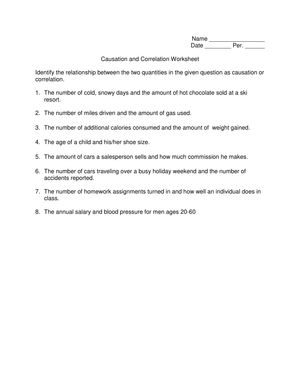
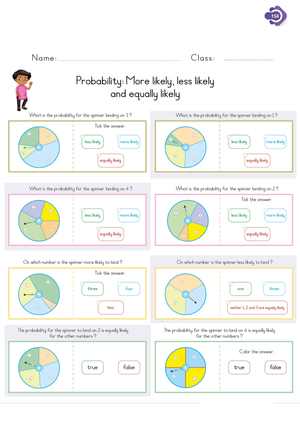
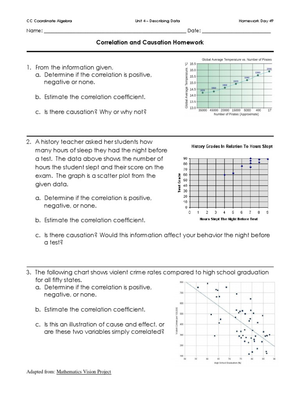
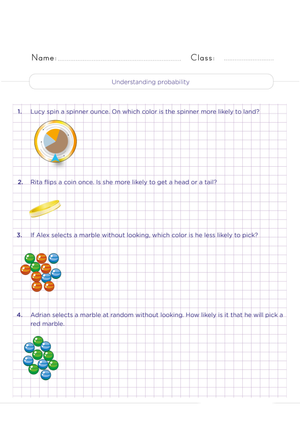
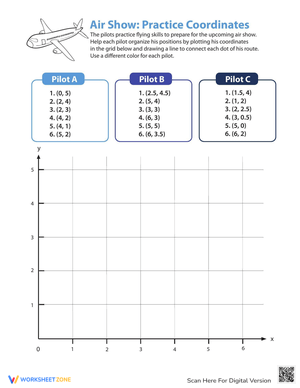
- Interpretation and reasoning: reading a display, connecting it to a real-world context, and selecting or writing a justification based on evidence from the graph or table.
Mistakes Students Make That These Worksheets Help You Catch
The most common breakdown in line plot work isn't a missing data point — it's a scale misread. Students who handle whole-number line plots confidently will often stumble the moment fractional intervals appear. A student working with a line plot scaled in fourths might count tick marks rather than read the labels, recording 1 3/4 as 1 1/2. That single error then corrupts whatever calculation follows, so the student's arithmetic looks wrong even though the actual problem was misreading the axis.
With measures of center, the confusion between median and mean is predictable but still worth watching closely. Students frequently apply the mean procedure — add all values, then divide — when they should be finding the median, especially under time pressure. A subtler error appears when students hunt for the mode: in a data set where two values appear equally often, many Grade 5 students report only the larger one rather than naming both or recognizing a bimodal set. Seeing that error on paper is faster than catching it during a whole-class discussion.
Standard Alignment
The line plot worksheets align directly to 5.MD.B.2, the Grade 5 measurement and data standard that asks students to create a line plot for a data set of fractional measurements and use that display to solve problems. In classroom terms, that means students should not only place values on a number line but also answer questions that require reading across the entire display — finding the difference between the longest and shortest measurement, or identifying the most common value. A worksheet that asks students to plot data and stops there doesn't fully address the standard. These resources include the follow-up questions that complete the practice.
Mean, median, mode, and range are not named in 5.MD.B.2, but they appear in many state-level Grade 5 frameworks and in most district review sequences. Including those skills supports teachers who address data broadly before a unit assessment or standardized review period, and it helps students connect representation to calculation rather than treating graphing and statistics as separate units.
Building These Worksheets Into Your Lesson Plans Effectively
The most efficient use of these resources is matching the format to the moment in instruction. A line plot worksheet with fractional intervals makes a strong whole-group warm-up when students have just been introduced to the concept — project one problem, work through the scale together, then release students to finish the rest independently. That sequence takes roughly fifteen minutes and ends with a clear picture of who still needs support before you move forward.
For small-group reteach, pull worksheets focused on one specific skill — fractional line plots, or finding median from an odd-numbered set — and work through two problems alongside students before asking them to try one on their own. A targeted worksheet keeps the group focused in a way that a longer mixed-review assignment rarely does.
A few other placements that fit a typical Grade 5 week:
- Homework: one worksheet with a line plot problem and two or three analysis questions is enough to check for understanding without overwhelming families.
- Math stations: pair students and ask them to check each other's mean and median calculations before recording final answers.
- Sub plans: worksheets with clear directions and familiar formats allow students to work independently without teacher explanation.
- Exit tickets: a short interpretation question drawn from a completed graph gives you a clear picture of who can reason from data without prompting.
Teachers can increase rigor without changing the worksheet at all. After students finish, ask them to explain in writing which measure of center best describes that data set, or describe how removing the highest value would affect the range. That oral or written extension costs nothing and surfaces reasoning that the worksheet alone doesn't require.
Differentiating the Set for a Range of Learners
For students still consolidating whole-number work, begin with the line plot and frequency table worksheets before assigning fractional intervals. The measurement context in 5.MD.B.2 assumes students can already place whole-number values on a number line accurately. Moving to fractions before that foundation is solid usually produces errors that look like data misunderstanding but are actually number-line confusion — two different problems that call for different responses.
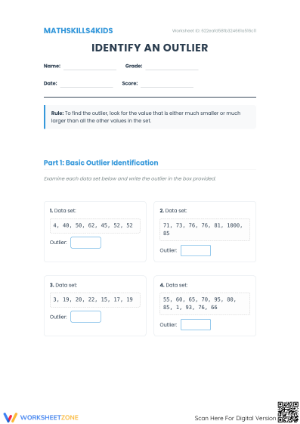
Students who move through the core worksheets quickly can extend their thinking without changing the resource. Present a data set with an obvious outlier and ask how removing it would change the mean versus the median — that reasoning task sits above grade level for most students but requires no additional materials beyond the worksheet already in hand.
For students with persistent computation difficulties, allowing a calculator during mean and range problems keeps the focus on statistical reasoning rather than multi-step arithmetic. The interpretation questions in this set still carry full instructional weight even when students don't calculate by hand, because reading and explaining a display is a different skill from computing accurately.
Using These Worksheets for Review Before Assessments
Data and statistics questions on standardized assessments frequently ask students to do two things at once: read a display accurately and then apply a calculation or make a comparison. That combination trips up students who have practiced graphing and computing measures separately but have never connected the two skills on the same task. The word-problem worksheets in this set place a data display and a reasoning question together, which mirrors the format students encounter on unit tests and state-style benchmarks.
Teachers who assign a single worksheet as a pre-assessment the week before a unit test — rather than waiting until review day — can identify one specific skill gap and address it while there's still time. If most errors cluster around fractional line plot reading, one focused reteach session usually resolves it. If errors spread across every skill on the page, the class likely needs broader review before the assessment. Using statistics pdf worksheets for 5th grade this way turns a practice tool into a planning tool.
Frequently Asked Questions
Which data topics appear most often on Grade 5 math assessments?
Line plots with fractional measurements, tied directly to 5.MD.B.2, appear most consistently across state and district assessments. Mean, median, mode, and range are included on many state benchmarks as well, typically in the context of a small data set or a display students must read first. Students who can read a graph, apply a calculation from its values, and explain what the result means are prepared for the range of question formats they're likely to encounter.
Can these worksheets work for students who are behind grade level?
Yes, with some adjustment to where you start. Begin with worksheets that use whole-number data sets and simple displays before assigning fractional line plot work. The mean, median, mode, and range worksheets use small data sets with manageable numbers, which reduces the arithmetic load while still asking students to reason statistically. If a student is significantly behind in number sense, pairing each worksheet with a number line reference keeps the statistical thinking accessible without removing the challenge of the task itself.
Are these worksheets better for in-class practice or homework?
Both work, but the answer depends on the skill. Line plots with fractional intervals are better kept in class the first time students encounter them — a student who misreads the scale at home will repeat that error across every problem before anyone catches it. Mean, median, mode, and range worksheets are more suitable for homework once the procedures have been introduced and practiced together in class. As a general rule, the first time students encounter a new statistics pdf worksheets for 5th grade task, keep it in the room where you can see the errors as they happen and address them before they calcify.