


Views
Downloads
Mean Median Mode Range Worksheet | Essential Grade 6 Math
Paste this activity's link or code into your existing LMS (Google Classroom, Canvas, Teams, Schoology, Moodle, etc.).
Students can open and work on the activity right away, with no student login required.
You'll still be able to track student progress and results from your teacher account.
This Mean Median Mode Range worksheet empowers students to calculate and interpret the primary measures of central tendency and variability in numerical data sets. By engaging with these structured problems, learners develop the mathematical fluencies required to summarize data distributions and identify patterns in quantitative information through repeatable practice.
At a Glance
- Grade: 6 · Subject: Math
- Standard:
CCSS.6.SP.B.5.C— Summarize numerical data sets by giving quantitative measures of center and variability- Skill Focus: Statistical Averages & Range
- Format: 3 pages · 15 problems · Answer key included · PDF
- Best For: Independent math center or homework practice
- Time: 25–40 minutes
What's Inside
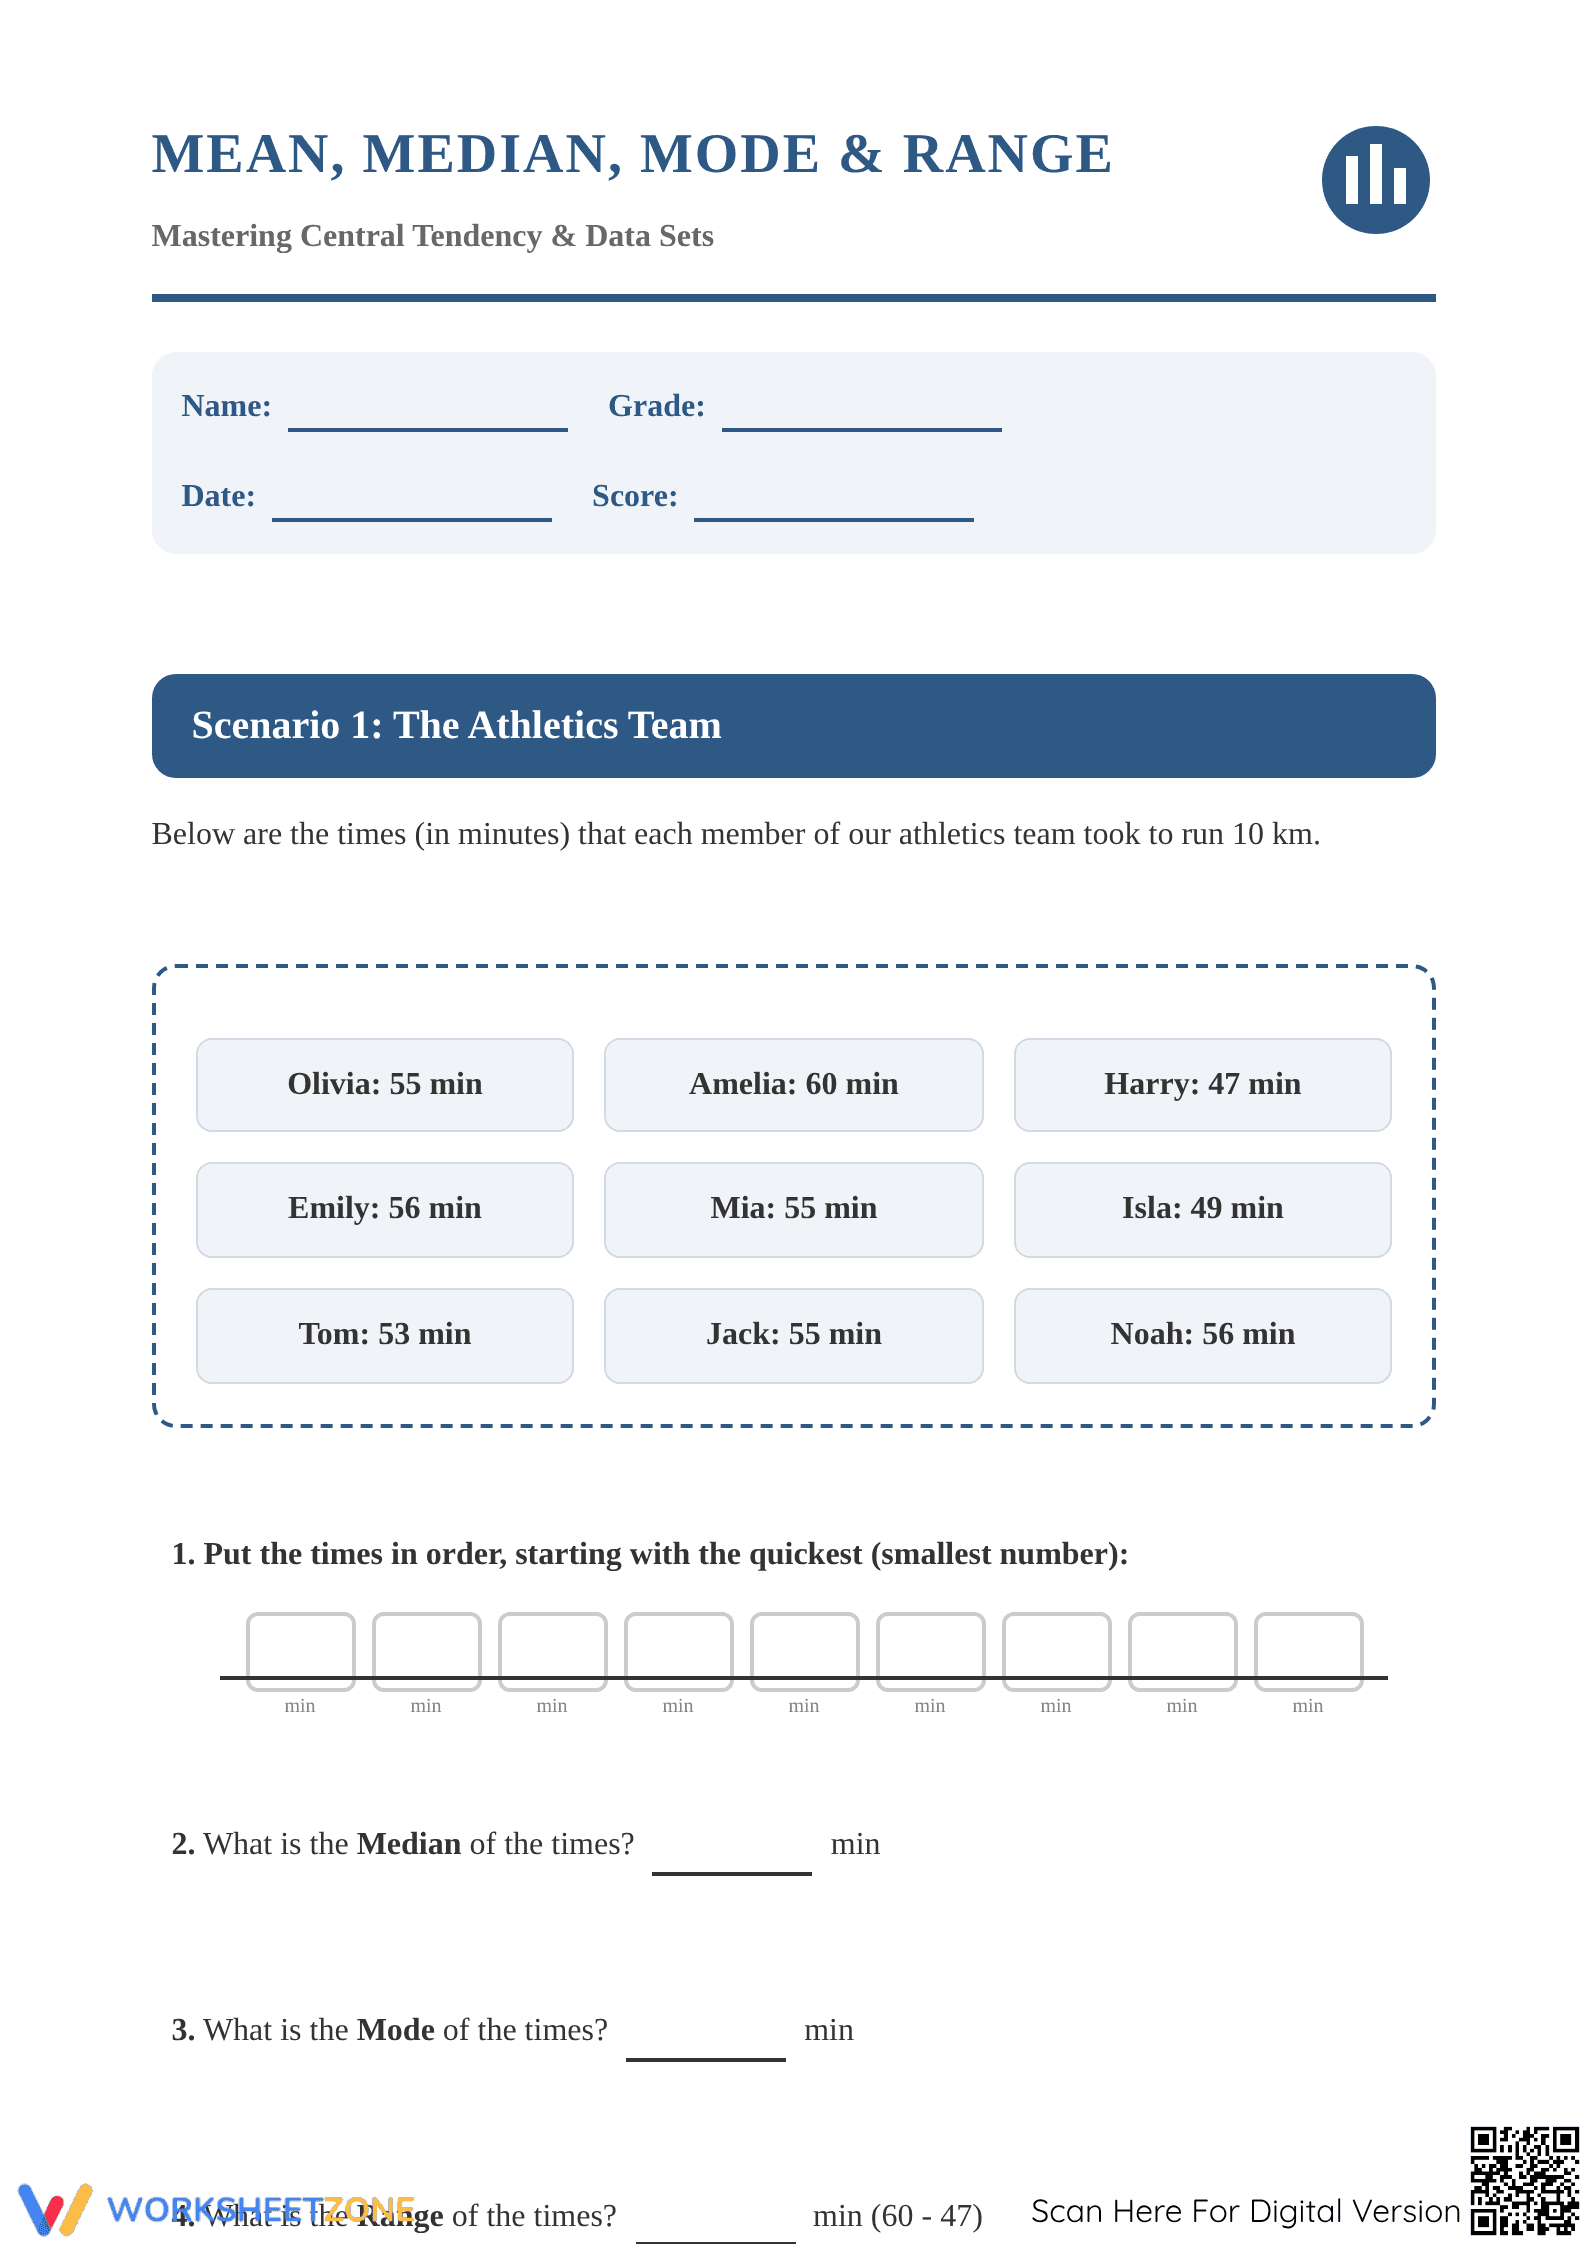
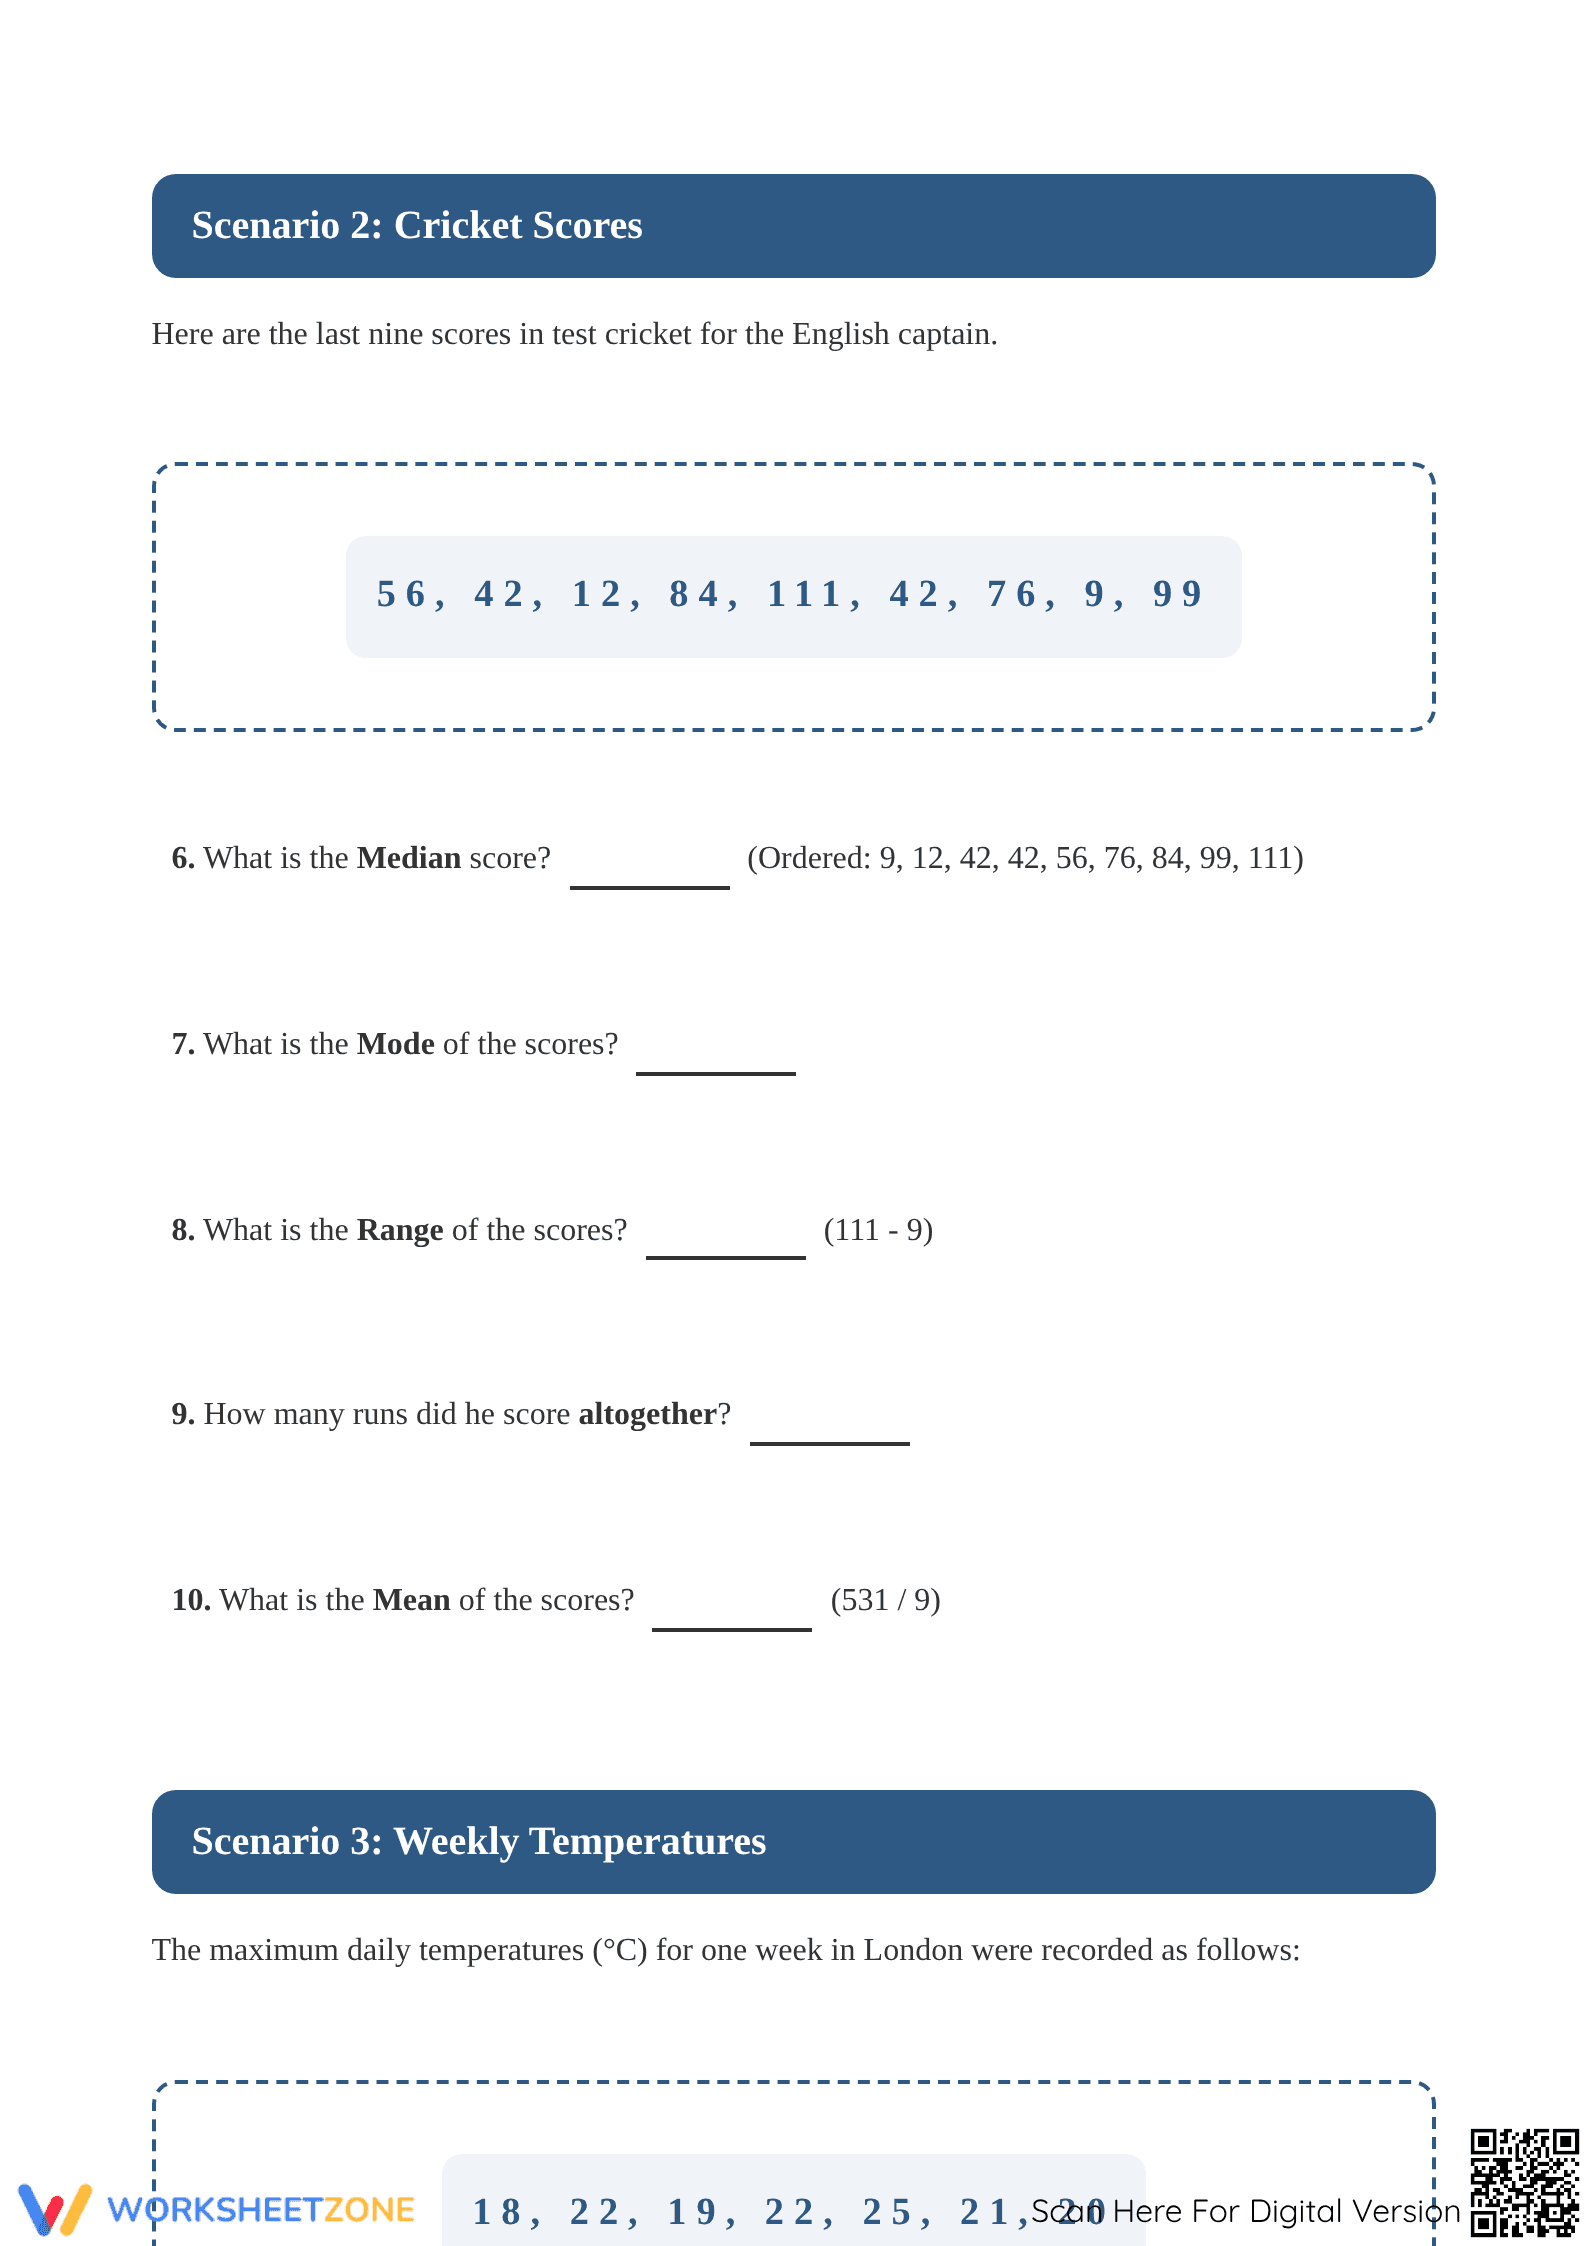
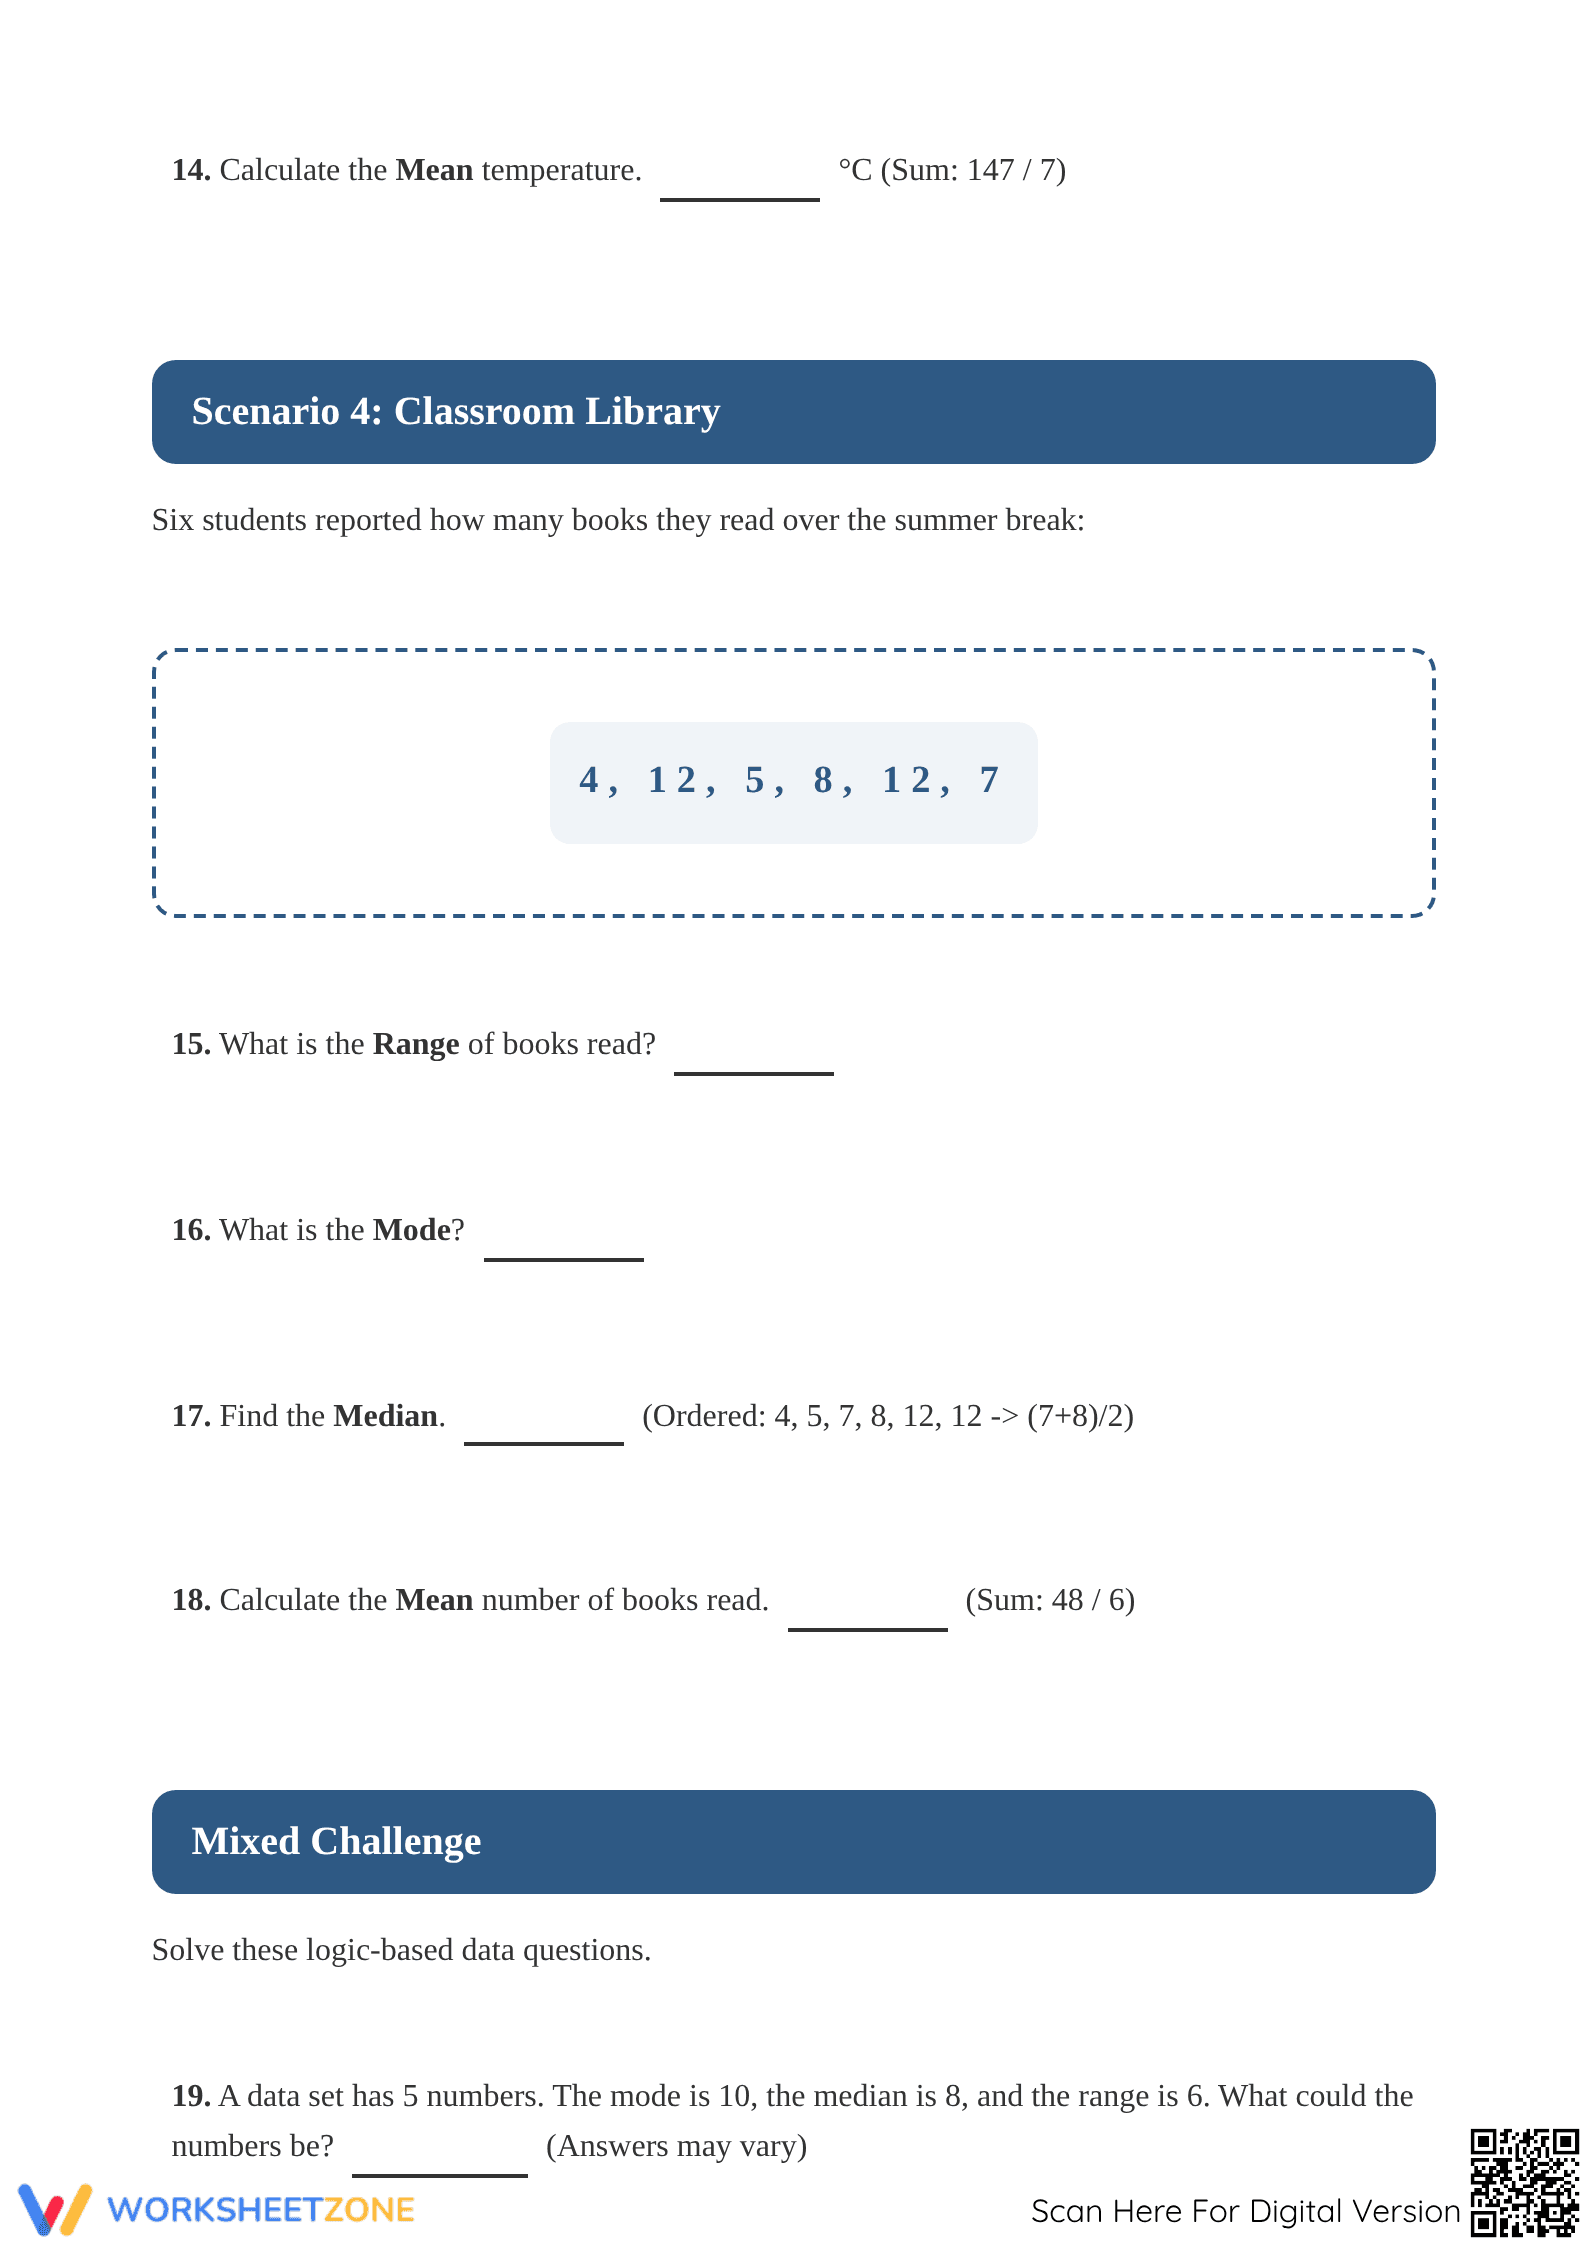
Inside this 3-page printable PDF, you will find 15 distinct data sets ranging in complexity. Each task requires students to find the mean, median, mode, and range for a specific list of numbers. The layout provides ample workspace for calculations, including space for ordering numbers to find the median. A comprehensive answer key is included for rapid grading.
Skill Progression
- Guided Practice: The first page features smaller data sets with single-digit integers to ensure students understand the four distinct procedural algorithms without heavy computational load.
- Supported Practice: The middle section increases data set sizes, requiring students to carefully track more variables and identify multiple modes or handle larger sums for mean calculations.
- Independent Practice: Final problems challenge students to maintain accuracy across multi-digit data points, reinforcing the discipline needed for high-stakes testing environments and advanced data analysis.
Standards Alignment
This resource is strictly aligned to `CCSS.MATH.CONTENT.6.SP.B.5.C`, which tasks students with summarizing numerical data sets by giving quantitative measures of center (median and/or mean) and variability (interquartile range and/or mean absolute deviation). This standard code can be copied directly into lesson plans, IEP goals, or district curriculum mapping tools.
How to Use It
Utilize this worksheet during the independent practice phase of your statistics unit. After direct instruction on each measure, assign one page as a formative check to observe if students are correctly ordering sets before identifying the median. Expected completion time for all three pages is approximately 35 minutes for a standard Grade 6 learner.
Who It's For
This resource is designed for Grade 5 and Grade 6 students who are beginning their journey into descriptive statistics. It serves as an excellent scaffold for English Language Learners who benefit from the repetitive vocabulary of Mean, Median, Mode, and Range paired with consistent numerical tasks.
According to Fisher & Frey (2014), the gradual release of responsibility model is essential for mastering mathematical abstractions like measures of central tendency. This worksheet applies that framework by providing consistent repetition across fifteen data sets, allowing students to internalize the distinct procedures for calculating the arithmetic mean, ordering values for the median, identifying the frequency of the mode, and determining the spread via the range. Research from the NAEP suggests that students who can fluidly navigate between these measures demonstrate higher proficiency in data analysis and statistical reasoning in secondary education. This resource aligns with CCSS.6.SP.B.5.C by requiring students to summarize numerical data sets through quantitative measures of center and variability. By isolating these calculations in a focused practice environment, teachers can identify specific procedural errors before students transition to complex data interpretation tasks. This targeted approach ensures that the foundational mechanics of statistics are secured for Grade 5 and Grade 6 learners.