


Views
Downloads
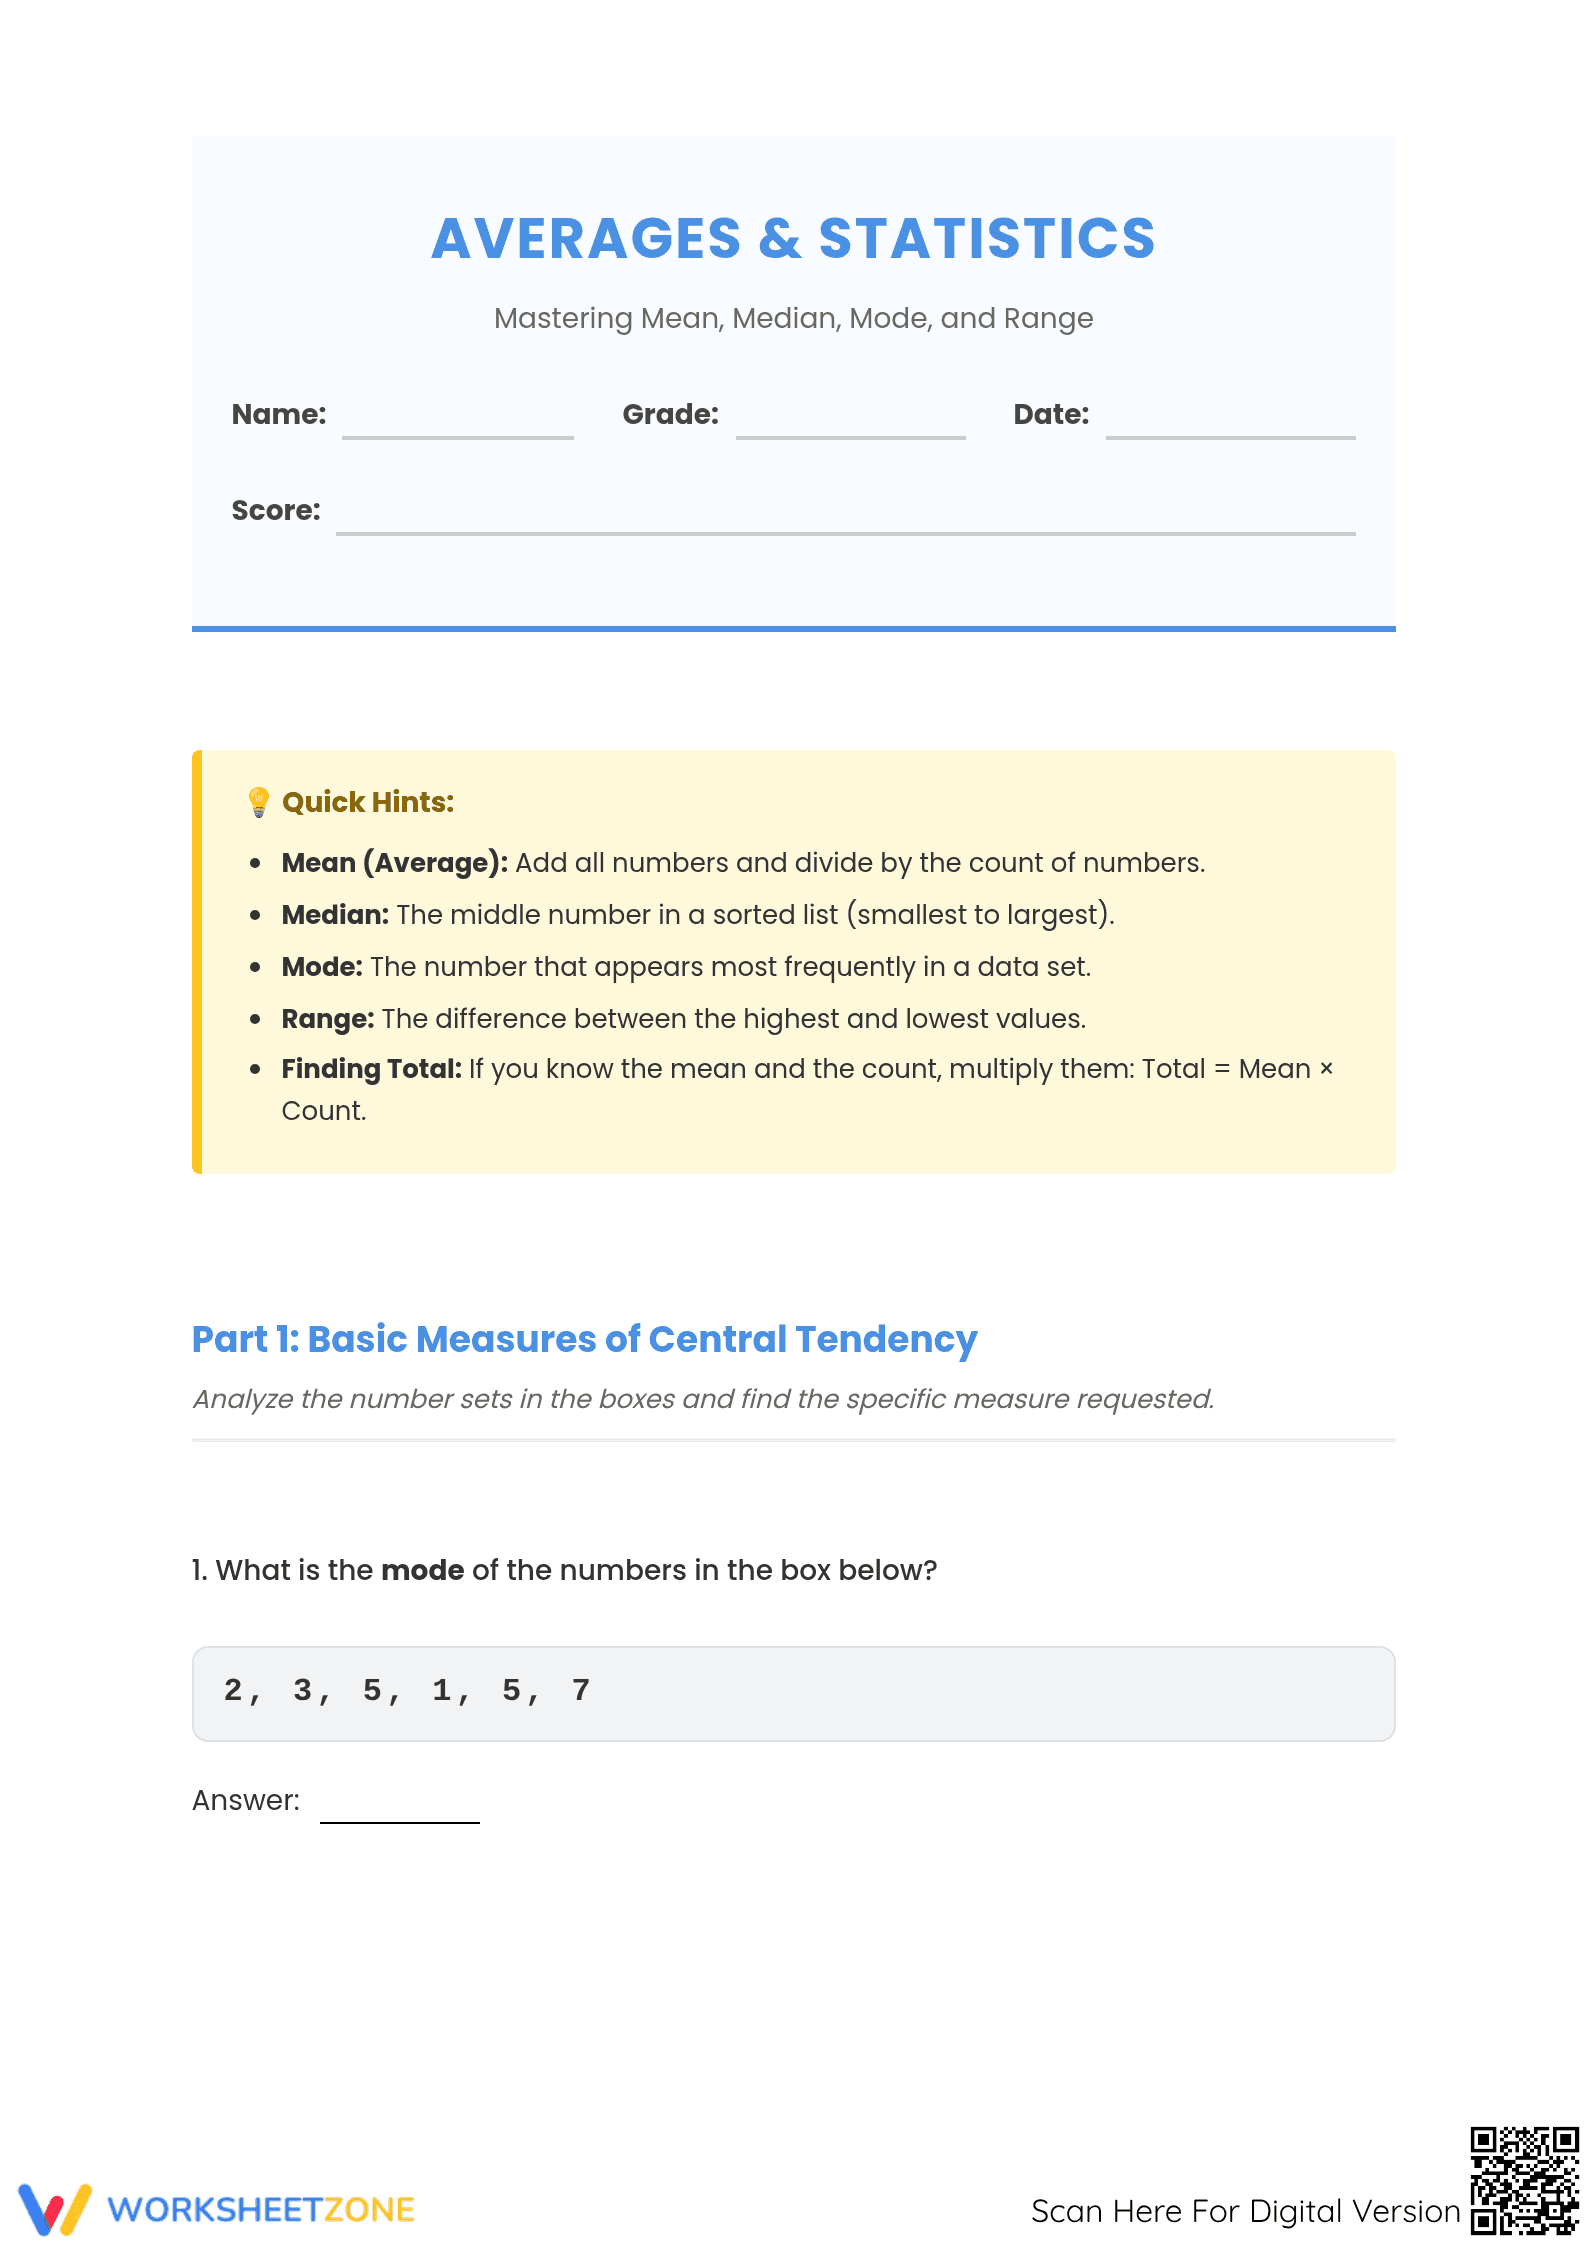
Essential Averages Worksheet | Grade 5 Math Statistics
Paste this activity's link or code into your existing LMS (Google Classroom, Canvas, Teams, Schoology, Moodle, etc.).
Students can open and work on the activity right away, with no student login required.
You'll still be able to track student progress and results from your teacher account.
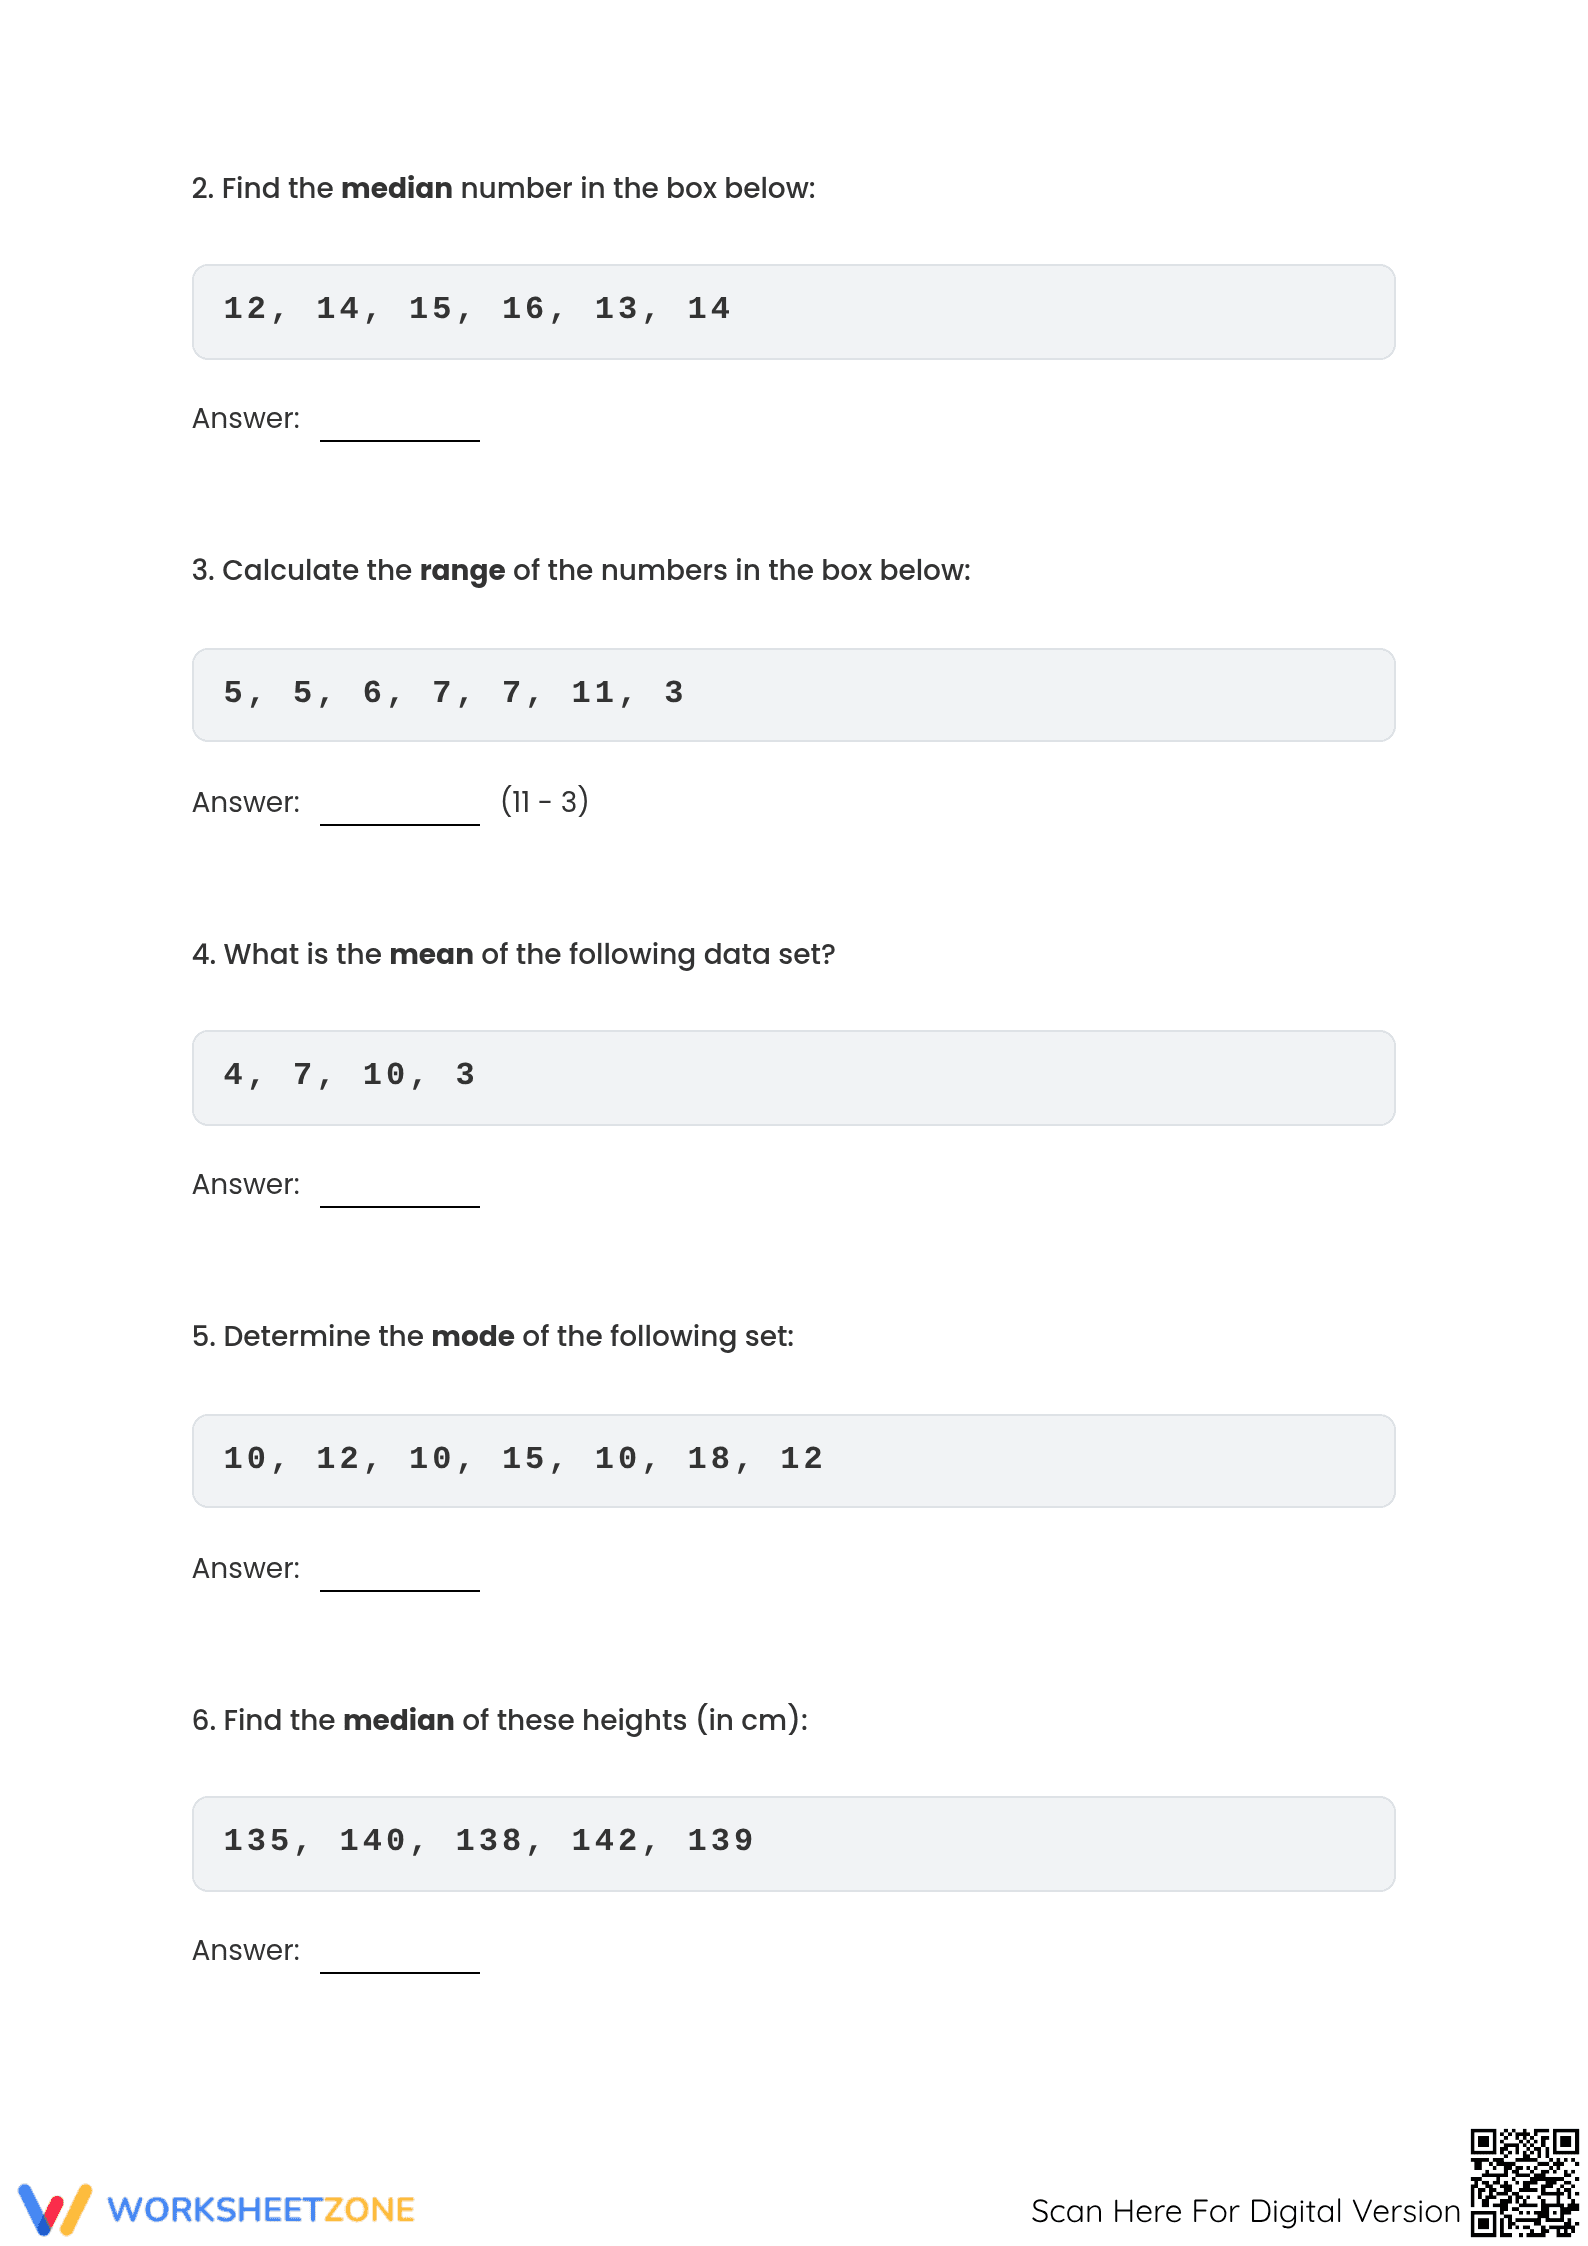
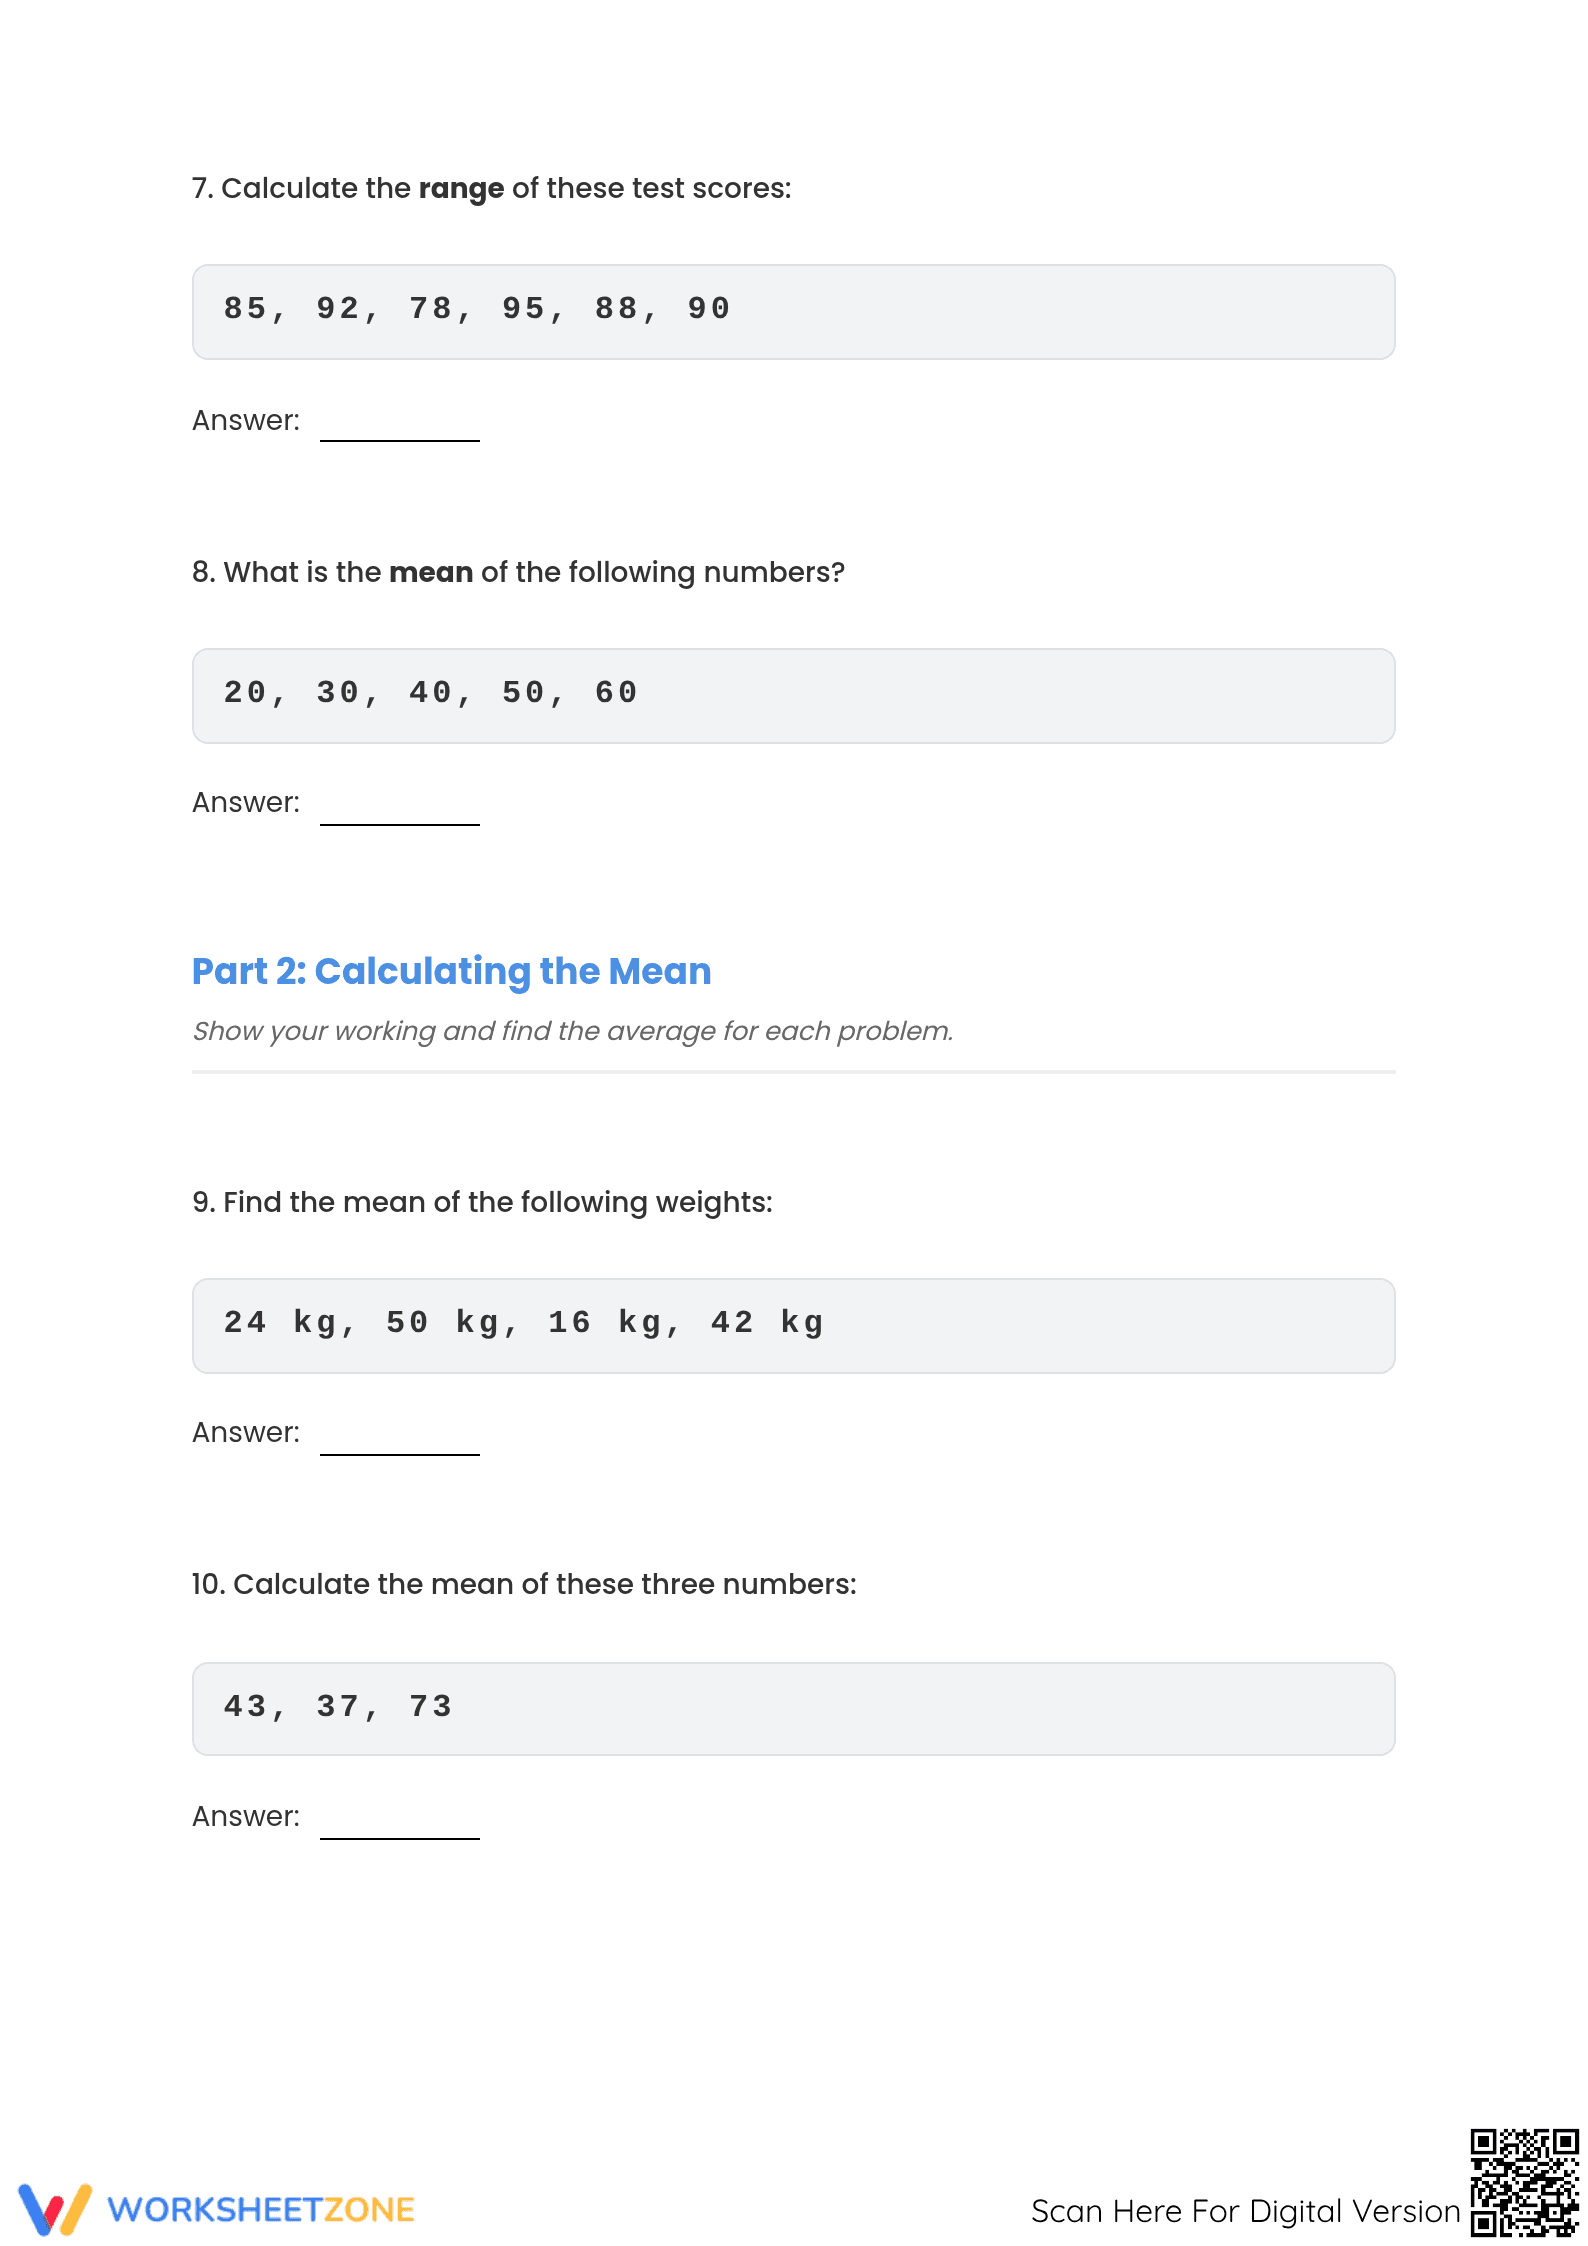
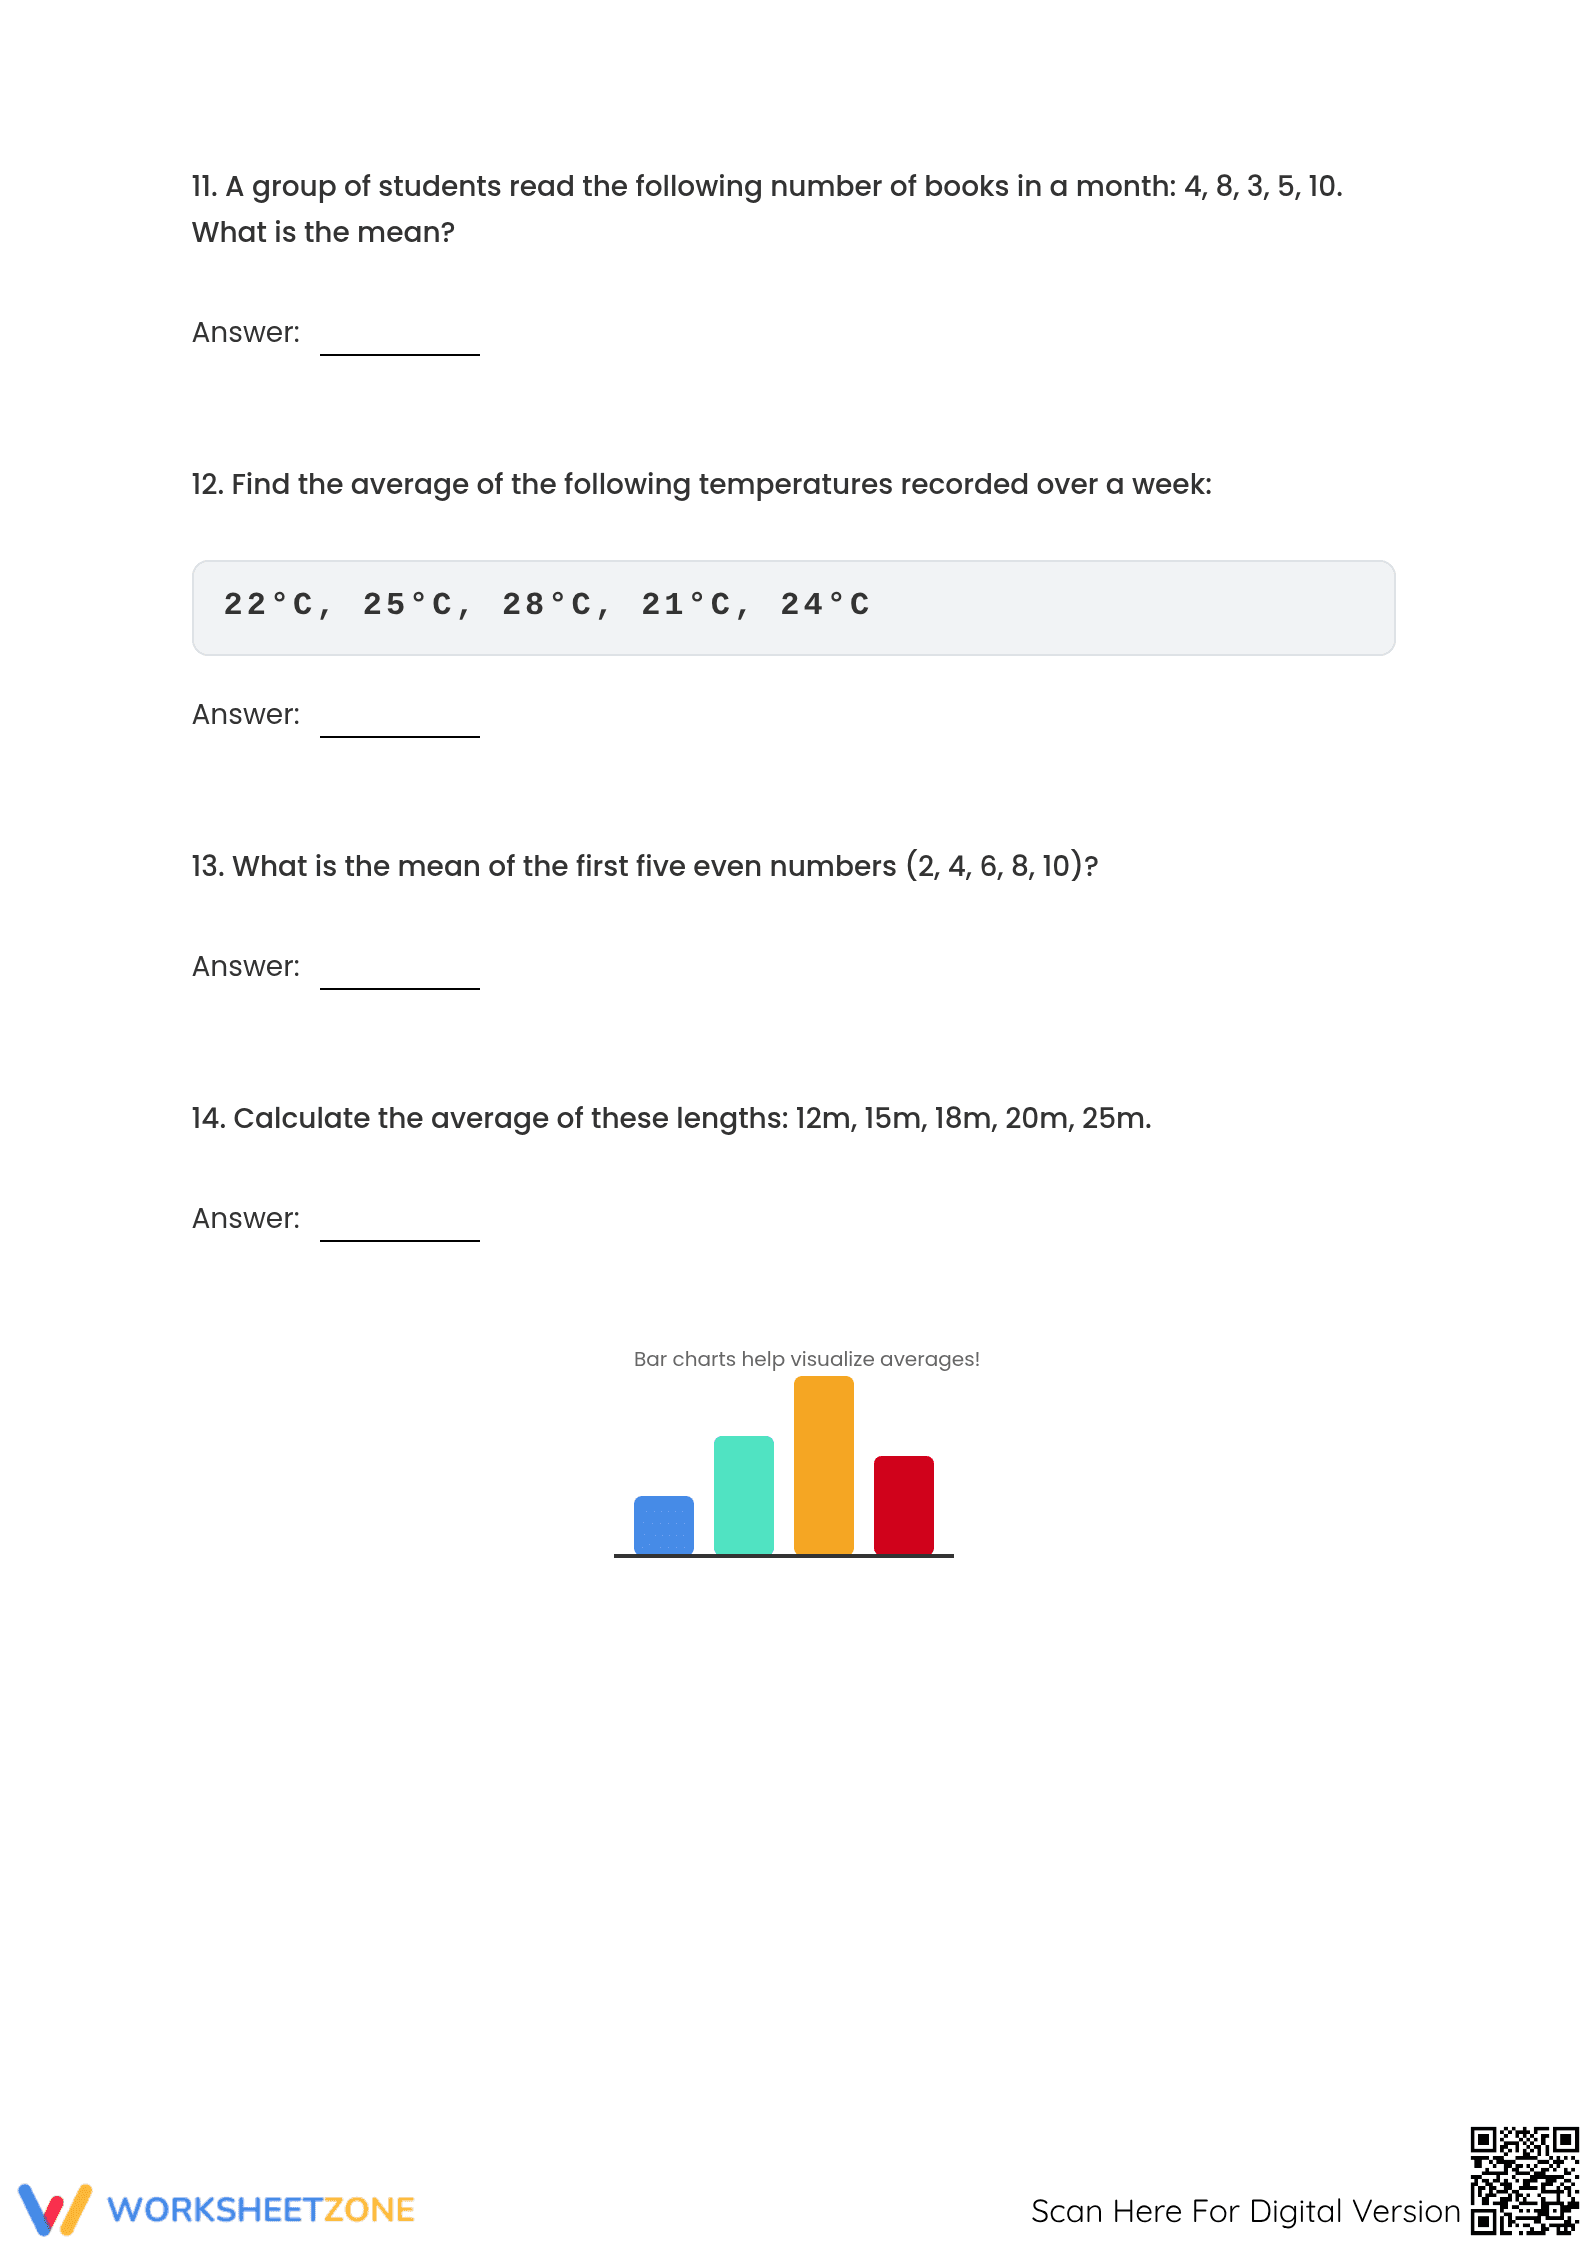
This comprehensive averages worksheet empowers students to master the four pillars of basic statistics: mean, median, mode, and range. By calculating measures of central tendency across 20 diverse problems, learners develop the fluency needed to interpret data sets accurately. This resource ensures students move beyond rote calculation toward conceptual understanding.
At a Glance
- Grade: 5 · Subject: Math
- Standard:
CCSS.MATH.CONTENT.6.SP.B.5— Summarize numerical data sets by giving quantitative measures of center and variability- Skill Focus: Mean, Median, Mode, and Range
- Format: 5 pages · 20 problems · Answer key included · PDF
- Best For: Independent practice and formative assessment
- Time: 30–45 minutes
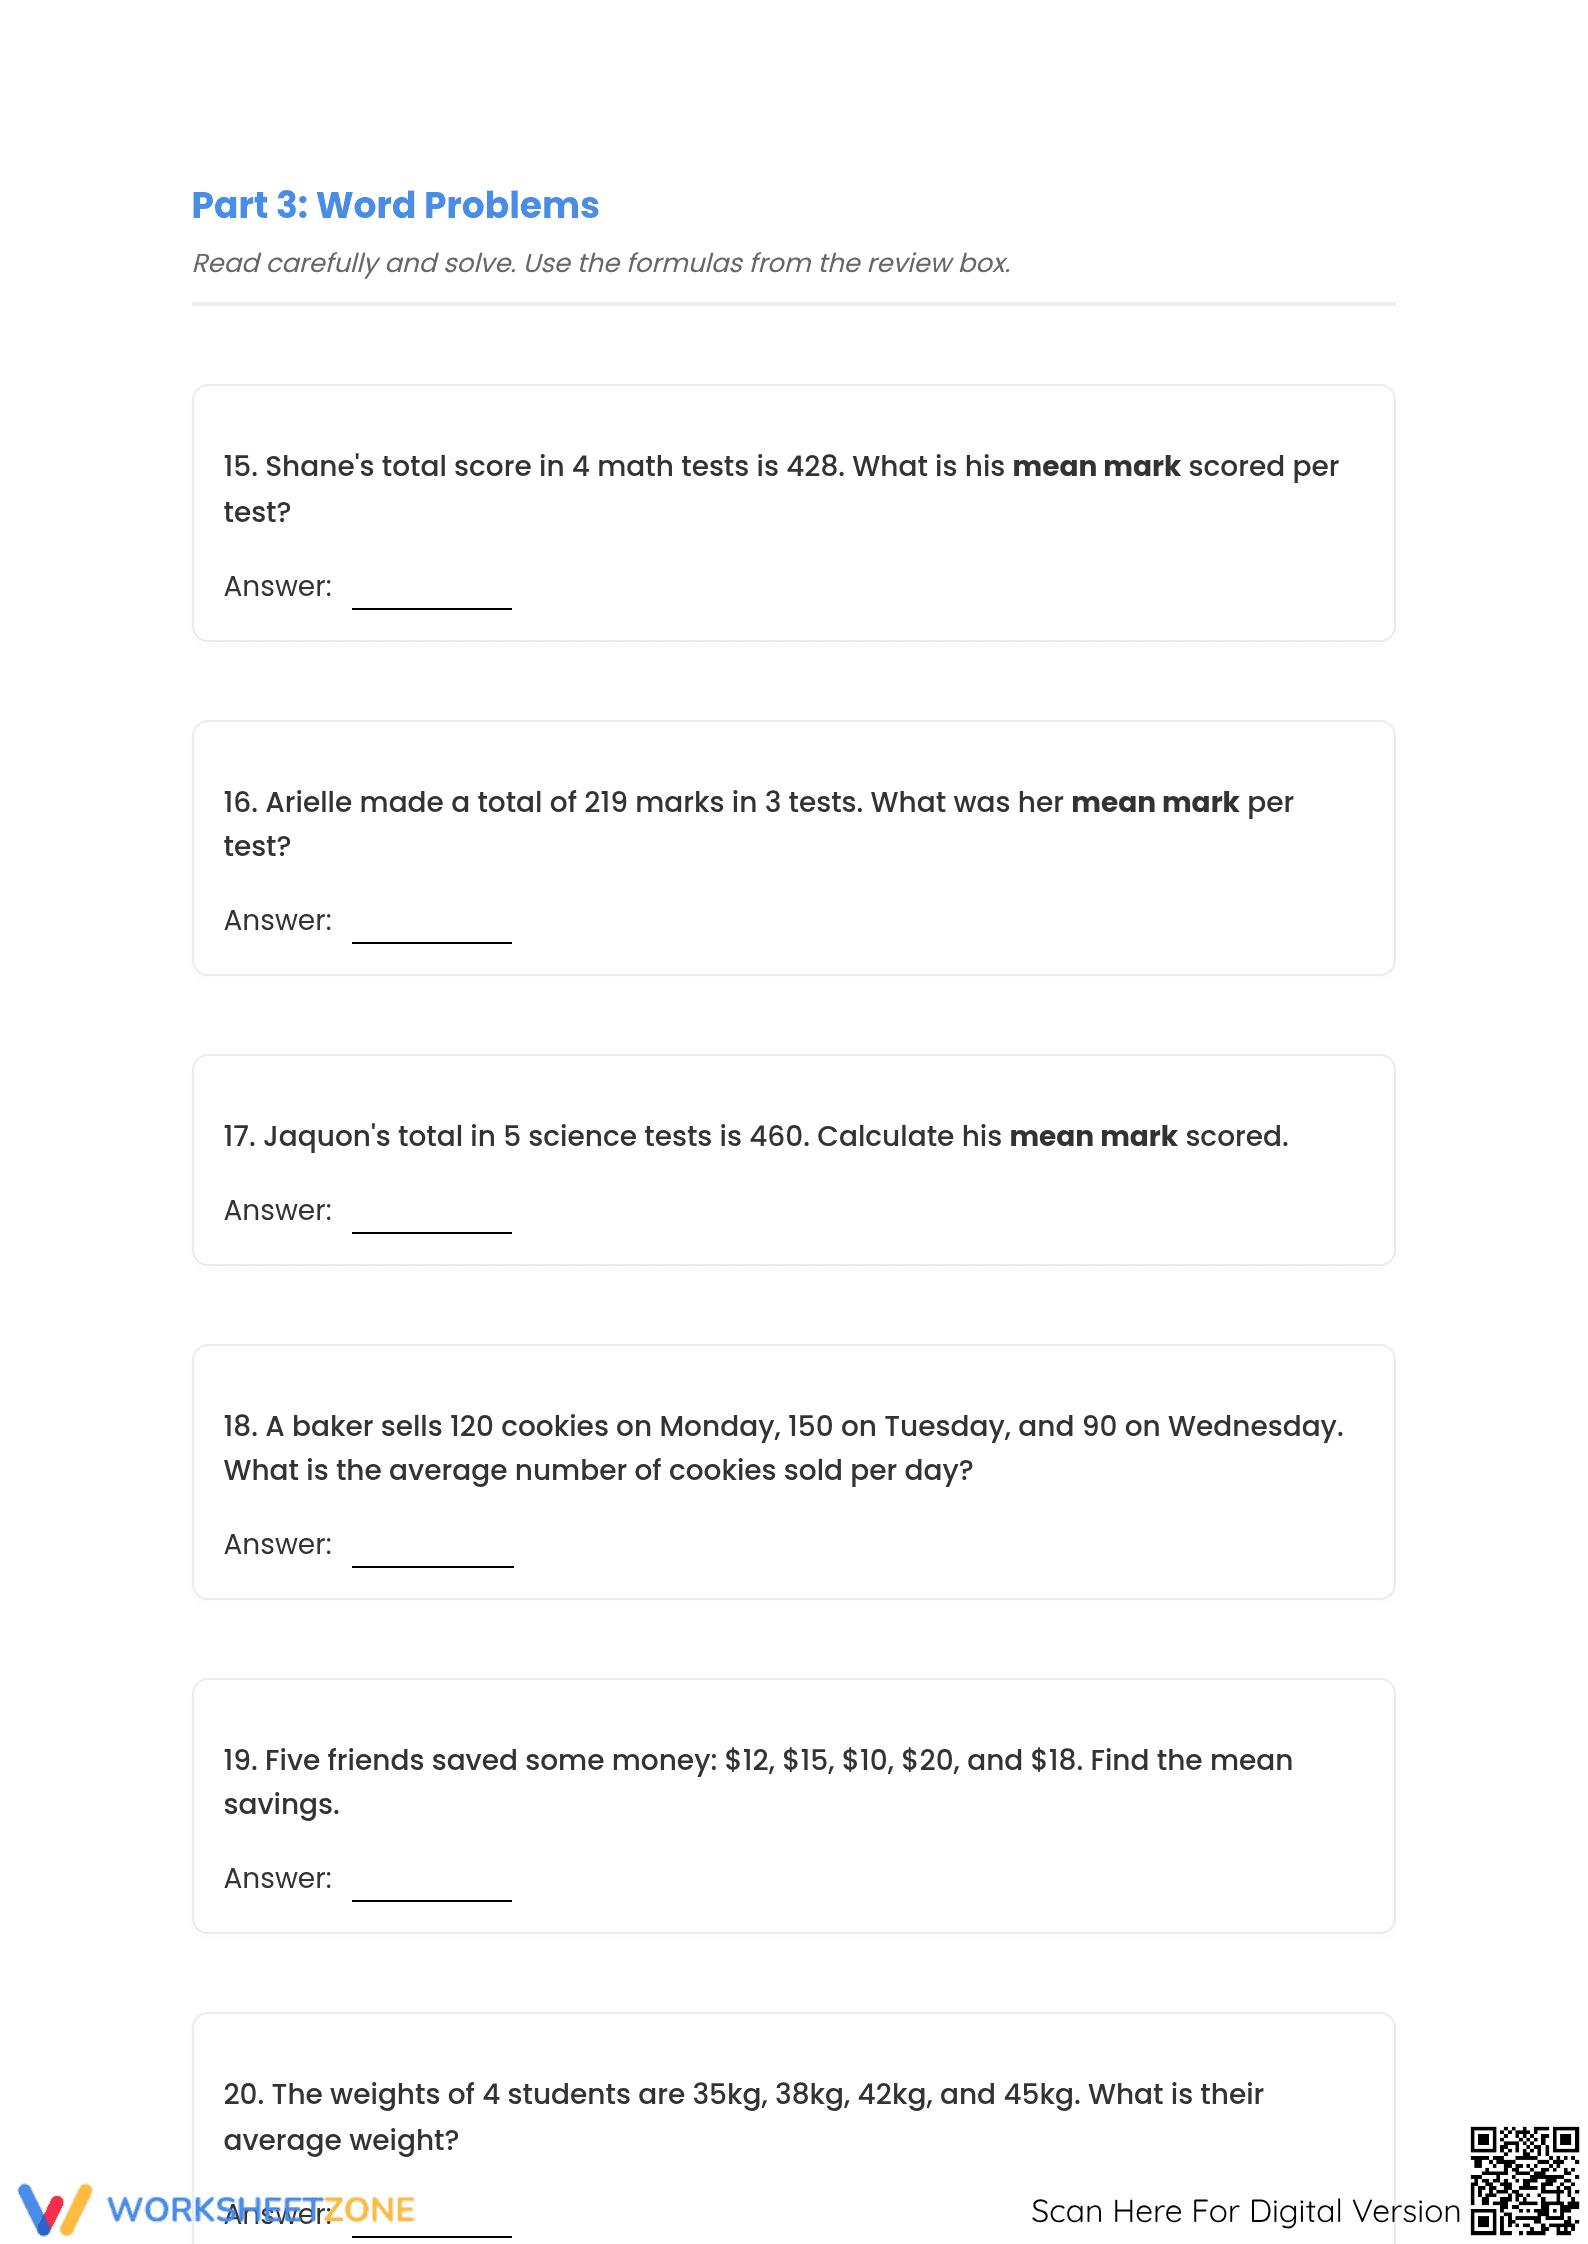
The PDF contains five structured pages featuring 20 distinct problems. It begins with a "Quick Hints" reference box that defines each statistical term and provides calculation formulas. The tasks progress from basic identification of measures to complex word problems involving weights, temperatures, and test scores. A complete 5-page answer key is provided for rapid grading.
Zero-Prep Workflow
This resource is designed for a three-step zero-prep workflow. First, print the five-page packet (30 seconds). Second, distribute to students as an independent desk activity or sub plan (1 minute). Third, use the provided answer key to review results or allow for student self-correction (under 1 minute). Total teacher preparation time is less than two minutes.
Standards Alignment
The primary focus is `CCSS.MATH.CONTENT.6.SP.B.5`, which requires students to summarize numerical data sets in relation to their context. This includes calculating the mean and median as measures of center and the range as a measure of variability. Both standard codes can be copied directly into lesson plans, IEP goals, or district curriculum mapping tools.
How to Use It
Use this worksheet during the independent practice phase of a lesson on statistics. It serves as an excellent formative assessment tool; observe students during Part 1 to see if they are correctly ordering data sets before finding the median. Expected completion time ranges from 30 to 45 minutes depending on calculation speed and student familiarity with division.
Who It's For
This is ideal for Grade 5 students ready for introductory statistics or Grade 6 students requiring reinforcement of measures of center. It pairs naturally with a visual anchor chart or a direct instruction lesson on data distribution. The inclusion of word problems makes it suitable for applying math skills to real-world scenarios.
According to the Fisher & Frey (2014) framework for gradual release of responsibility, providing students with structured "Quick Hints" alongside independent practice facilitates the transition from guided instruction to mastery. This worksheet applies that research by embedding definitions directly on the first page, reducing cognitive load during the initial calculation phase. By solving 20 problems that vary in context—from lengths to temperatures—students build the statistical literacy required by the CCSS.MATH.CONTENT.6.SP.B.5 standard. Research from the NAEP suggests that early exposure to data interpretation is a significant predictor of success in middle school algebra. This resource provides the necessary repetition and scaffolding to ensure students can accurately summarize numerical data sets and identify quantitative measures of center and variability without teacher intervention.