These data and graphing worksheets pdf for 5th grade cover the full range of display types fifth graders are expected to read, build, and interpret — line plots with fractional measurements, bar and double bar graphs, line graphs, coordinate plane work, histograms, and introductory statistics including mean absolute deviation. The set is organized by skill category so teachers can pull exactly the worksheet they need without sorting through unrelated material.
What Students Actually Do on These Worksheets
Grade 5 data work asks more of students than naming chart parts or counting bars. These worksheets push students to compare categories, describe change over time, solve multi-step problems from a display, and explain their reasoning in writing. A student who reads a bar graph with confidence may stall on a line plot once fractions enter the scale, and a student who plots coordinate pairs correctly may still write a vague explanation when asked what the data shows. Working across multiple display types — rather than spending an entire unit with one format — surfaces those gaps early.
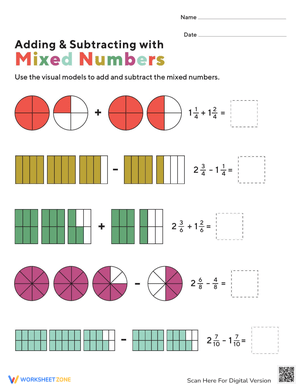
- Line plots — students place fractional measurements accurately, then answer questions that require adding or subtracting fractions from values on the display.
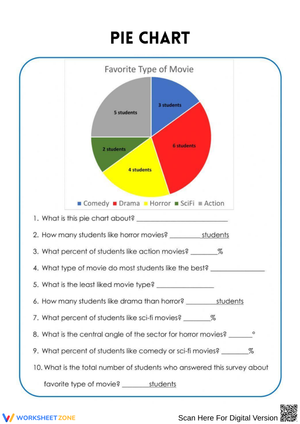
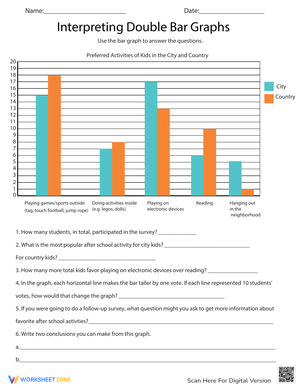
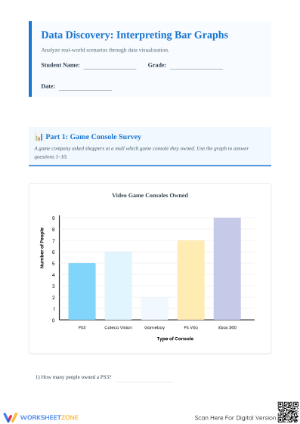
- Bar and double bar graphs — students read values, compare categories, and work through multi-step questions that require operating on the data rather than just reading it.
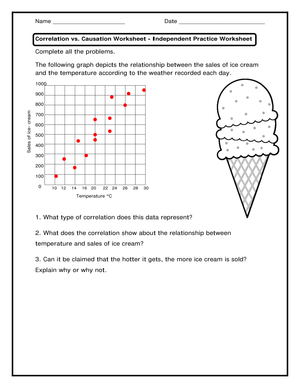
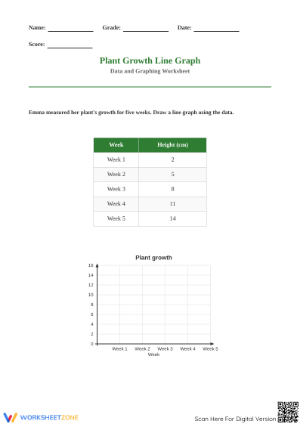
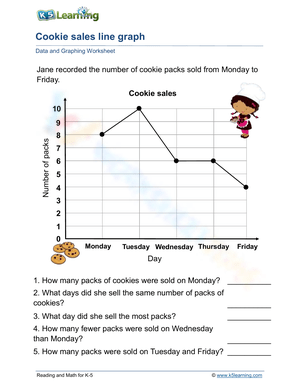
- Line graphs — students describe change over time, identify trends, and support explanations with specific evidence from the graph.
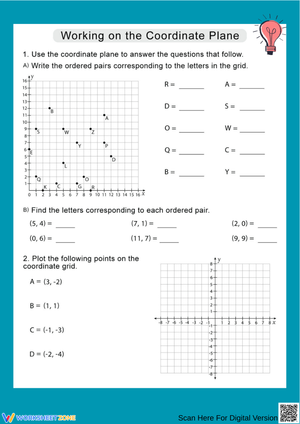
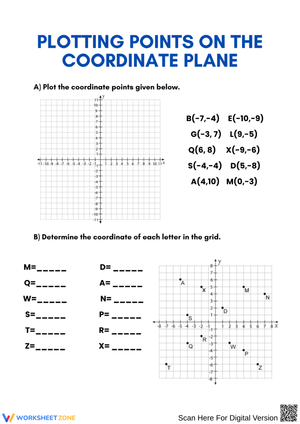
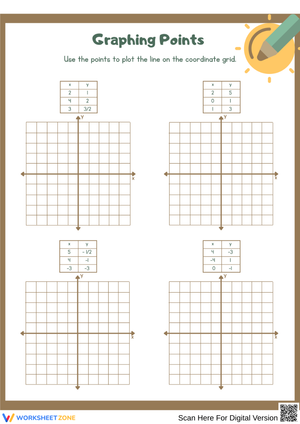
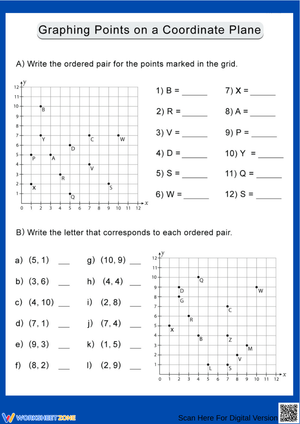
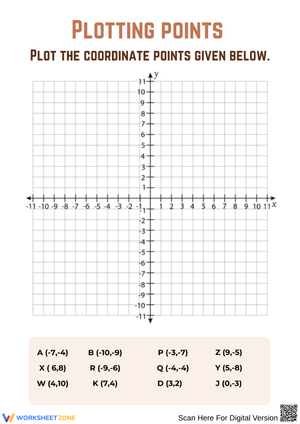
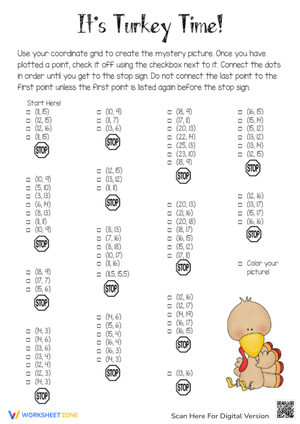
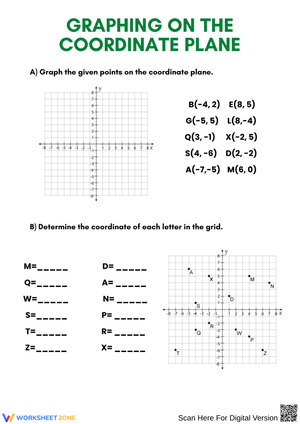
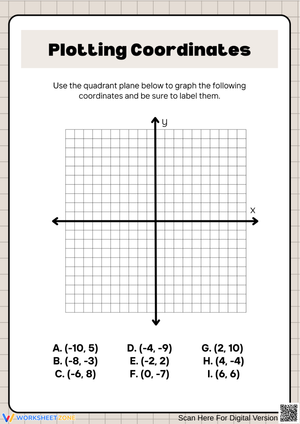
- Coordinate graphing — students plot ordered pairs, identify locations, and connect points to real-world situations on the coordinate plane.
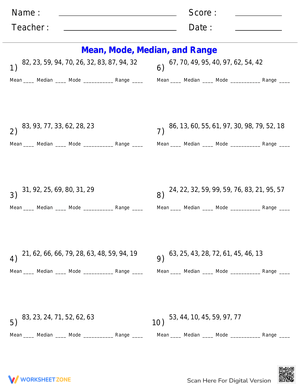
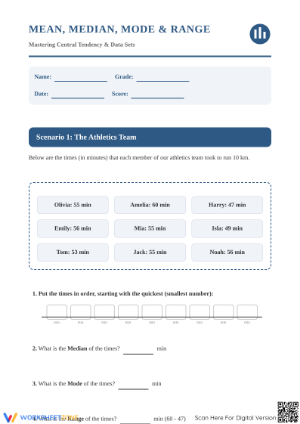
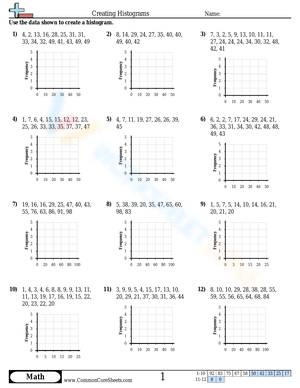
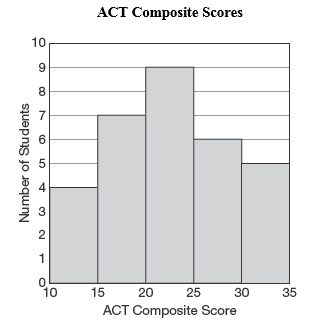
- Histograms and data distributions — students group larger data sets into intervals and describe the spread and center of the distribution.
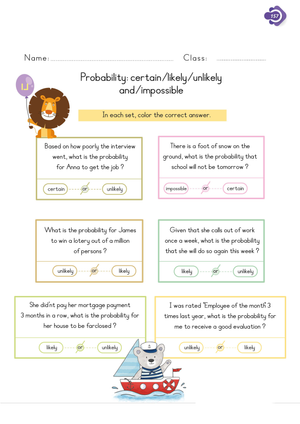
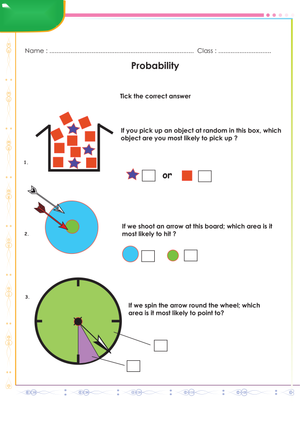
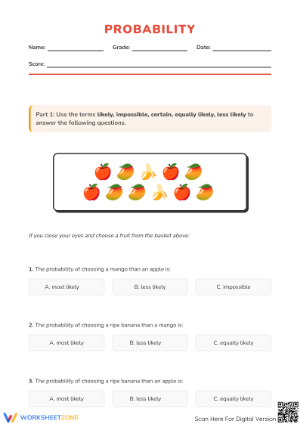
- Probability — students apply basic chance language and make predictions grounded in data.
Errors That Show Up Consistently in Student Work
The most predictable mistake on bar graph worksheets is misreading scale intervals. Students count individual grid lines rather than reading the labeled increments, so a bar reaching the third line on a scale of 0, 5, 10, 15 gets recorded as 3 instead of 15. Addressing this before independent work — tracing from bar top to axis while naming the labeled values aloud — reduces that error significantly.
On coordinate graphing worksheets, the reversal error is persistent: students write (y, x) instead of (x, y). A consistent verbal cue like "over first, then up" during direct instruction gives students something to anchor the procedure before they start marking points. Without that anchor, the error carries through an entire set of ordered pairs.
Line plot worksheets with fractional measurements surface a third pattern. Students who mark 1/2 correctly will sometimes place 2/4 at a different location on the number line, treating them as distinct values. That is a fraction equivalence misconception showing up inside a graphing context — and seeing it on a line plot often catches students who worked through a purely numerical fractions task without revealing the same confusion. Noticing these patterns across data and graphing worksheets pdf for 5th grade helps teachers tell the difference between a graphing mechanics issue and a gap in an underlying concept.
Working These Worksheets Into Your Weekly Lesson Plan
A reliable structure is to pair a graph-reading worksheet with a graph-building worksheet in the same week, then compare the errors across both. When students answer questions from a finished display correctly but struggle to construct the same type of display from a data table, the problem is usually scale selection or axis labeling — not calculation. That distinction helps teachers reteach the right skill instead of repeating the whole lesson.
These worksheets fit the 8-to-10 minute warm-up before the math block, mid-lesson partner practice, and center rotations once students know the procedure. Coordinate graphing worksheets work especially well in centers — once the plotting routine is established, students move through a full set of ordered pairs independently. For the exit ticket slot before dismissal, a quick bar graph comparison question delivers readable formative data in under five minutes. For substitute plans, these graphing worksheets are among the most dependable choices: directions are visible on each worksheet, the task has a natural end point, and students complete meaningful practice without needing a long launch from an unfamiliar adult.
Standard Alignment
The anchor standard for Grade 5 data work in the Common Core State Standards is 5.MD.B.2, which asks students to make line plots using measurements in fractions — halves, quarters, and eighths — and solve problems by applying fraction operations to the data. In classroom terms, that means a line plot worksheet should ask students to do something with the organized data: find the difference between the highest and lowest values, total all measurements in a given interval, or compare two groups on the plot. A worksheet that stops at "place the data correctly" misses the standard's intent.
Coordinate graphing worksheets connect to 5.G.A.1 and 5.G.A.2, which introduce the coordinate plane and ask students to represent and interpret real-world situations by plotting and reading points. Bar and line graph work reinforces the interpretation and explanation skills that run through the broader 5.MD expectations and appear consistently in multi-step problem-solving tasks across the grade.
Adjusting the Set for a Range of Readiness Levels
Differentiation in graphing practice comes down to two variables: the complexity of the display and the depth of the question. The range within these data and graphing worksheets pdf for 5th grade means teachers can hold the same graph type constant across an entire class while adjusting both variables to address different readiness levels — no need to run parallel topics for different groups.
- For students who need support, choose worksheets with fewer data categories, whole-number scales, and direct one-step questions with clear wording.
- For on-level practice, use worksheets that mix direct reading with one written explanation requiring a specific value cited from the graph.
- For students ready to extend, assign worksheets that present two data displays side by side and ask which representation communicates the information more clearly — and why.
- For intervention groups, start with a worksheet that shows an incorrectly labeled or incomplete graph and ask students to identify and repair the error. That task often reveals more about student thinking than a correctly completed worksheet does.
One honest limitation: worksheets that use unfamiliar contexts — a data table about manufacturing output when students have spent the semester on community survey topics — slow down students who get stuck on the reading before they reach the math. Checking the context before assigning takes less than a minute and prevents that kind of stall during independent work.
Frequently Asked Questions
Which graph types are covered in this collection?
The collection includes line plots with fractional measurements, bar graphs, double bar graphs, line graphs, coordinate graphing worksheets, histograms, mean absolute deviation worksheets, and probability activities. Teachers can select by graph type to match whichever skill is currently under instruction.
Are these worksheets aligned to named Grade 5 standards?
The line plot worksheets connect directly to 5.MD.B.2, which requires students to create and interpret line plots with fractional measurements and apply fraction operations to solve problems from the data. The coordinate graphing worksheets address 5.G.A.1 and 5.G.A.2. Teachers who use data and graphing worksheets pdf for 5th grade as standards-aligned practice rather than supplemental review will find the line plot and coordinate graphing resources the most tightly connected to named Grade 5 expectations.
Can these worksheets serve both practice and formative assessment purposes?
Yes. Because students write directly on each worksheet — marking values, plotting points, annotating the graph — each completed task gives a clear record of what the student did and where the reasoning broke down. A finished double bar graph worksheet shows at a glance whether the student read the scale accurately and whether the written explanation cited specific values or stayed vague. That kind of readable evidence supports same-day planning for small-group follow-up without any additional assessment tool.