These 3rd grade graphing data worksheets give teachers ready-to-use practice for the point in third grade when data analysis gets genuinely hard — the shift from one-to-one picture graphs to scaled representations, and the introduction of measuring objects to the nearest quarter inch for fractional line plots. The set covers both 3.MD.B standards in enough depth to carry a full unit without supplementing from multiple sources.
Scaled Graphs and Line Plots: What Each Worksheet Covers
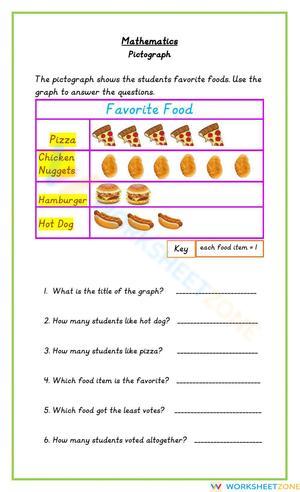
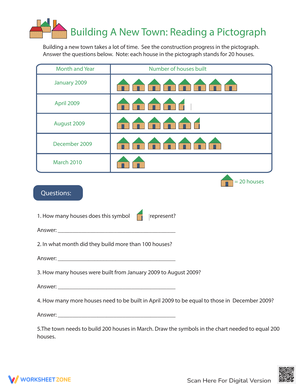
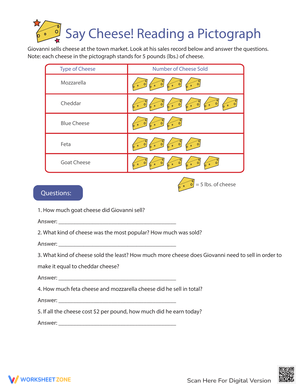
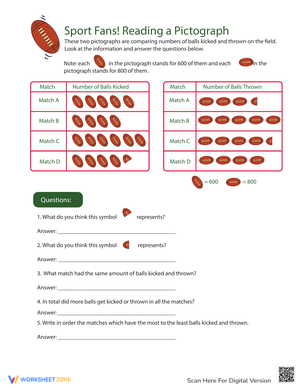
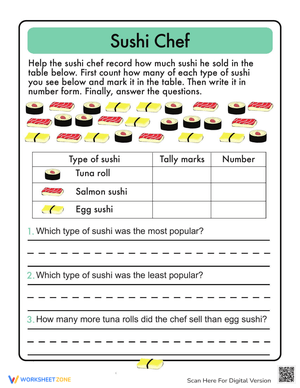
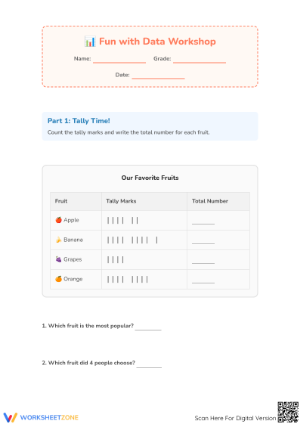
Each 3rd grade graphing data worksheets in this collection addresses one of the three graph types that define the Grade 3 data strand. Scaled pictograph worksheets ask students to apply a key — where one symbol represents two, five, or ten items — then use multiplication and division to find totals and solve comparison problems. The questions build from single-step reading to two-step comparisons, so students practice choosing which values to compare, not just executing a multiplication procedure.
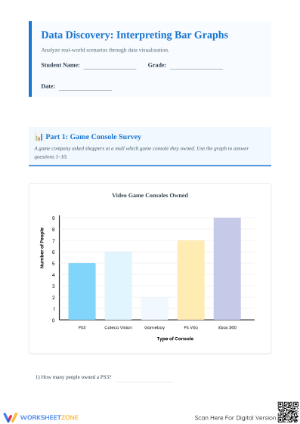
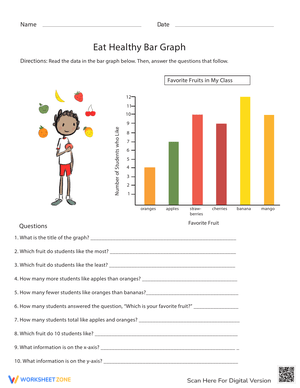
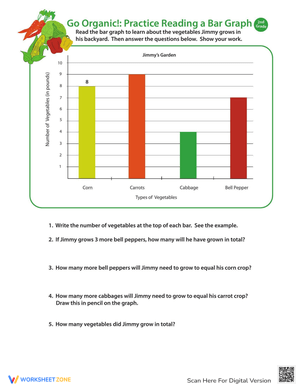
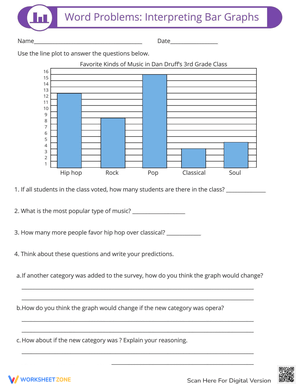
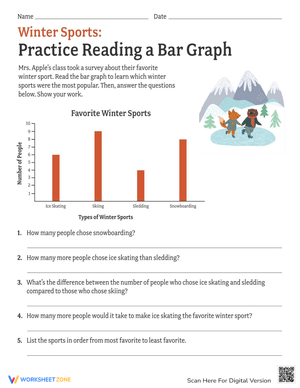
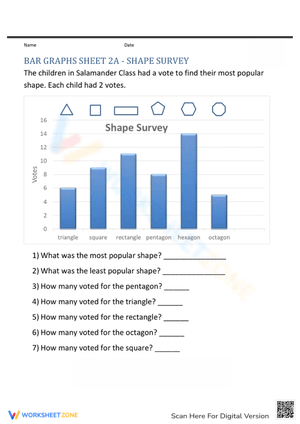
Scaled bar graph worksheets carry the same comparison work and add an axis-reading challenge. Students read values on a scale that jumps by set intervals, and the real skill test isn't reading bars that land on gridlines — it's reading bars that stop between them. Several worksheets include bars that fall exactly halfway between two scale marks, which is where procedural fluency ends and genuine interpretation begins.
Line plot worksheets close the sequence. Students measure objects to the nearest half or quarter inch, record each measurement as an X above a horizontal number line, and answer questions about the distribution — how many objects measured more than a given length, which measurement appeared most often, and related tasks. These worksheets require a ruler at each student's desk; the measurement step isn't optional.
Where Students Typically Go Wrong With Graphing and Data
The between-the-gridlines bar is the most consistent source of errors in scaled bar graph work. Students who read bars on gridlines correctly will still guess — usually defaulting to the lower gridline value — when a bar stops at 15 on a scale labeled 10 and 20. The students who multiplied 4 × 5 correctly for a bar landing on 20 will abandon that reasoning the moment there's any ambiguity in position. A brief class discussion of one such example before independent work reduces this substantially.
Fractional line plots surface a different, more specific problem. Students who can mark ½ on a number line will frequently misplace ¾ — pushing it too close to 1, treating it as "almost a whole number" rather than locating it exactly three tick marks past the previous whole. This is usually a ruler-reading gap, not a fraction misconception. Students who haven't counted all four quarter-inch subdivisions on a standard ruler carry those imprecise habits directly onto the line plot scale.
For comparison questions — "how many fewer students chose hiking than swimming?" — one of the more reliable error patterns is computing the correct difference but assigning the answer to the wrong category. A student calculates 22 − 15 = 7 accurately, then writes "7 more students chose hiking." The subtraction is right; the language of the comparison flips. Catching that error early in the unit keeps it from becoming a test-day habit.
Standard Alignment
CCSS.MATH.CONTENT.3.MD.B.3 requires students to draw scaled picture graphs and scaled bar graphs representing data with several categories, and to solve one-step and two-step "how many more" and "how many fewer" problems from those graphs. CCSS.MATH.CONTENT.3.MD.B.4 extends this into measurement: students generate data by measuring lengths to the nearest half or quarter inch, then represent that data on a line plot with a fractional horizontal scale.
Both standards fall within the Measurement and Data domain, but each pulls in skills from elsewhere in the grade. Scaled graph work depends on multiplication by multiples of 2, 5, and 10 — students without reasonable fluency on those fact families struggle to apply a key correctly. The line plot standard connects directly to CCSS.MATH.CONTENT.3.NF.A, specifically placing fractions on a number line. Introducing a 3rd grade graphing data worksheets from the line plot section before students have worked with fraction number lines produces a level of confusion that's difficult to untangle mid-lesson. Sequencing these after the relevant fraction instruction makes a real difference.
Building These Worksheets Into Your Data Unit
The most reliable pattern for bar graph and pictograph worksheets is a brief whole-class launch — projecting a graph, naming the scale or key together, working through one between-the-gridlines bar as a class — followed immediately by independent worksheet practice. That 8 to 10 minutes of shared interpretation isn't re-teaching; it's activating the scale-reading habit before students work alone. Classes that skip the launch and go directly to the worksheet show the between-the-gridlines error at a noticeably higher rate.
Line plot worksheets work better in a math center setup than during a whole-class work period at desks. A station with a small collection of classroom objects and a ruler lets students collect their own measurements before recording them. The sequence — measure, record, plot — internalizes faster when students generate the data themselves rather than reading pre-collected measurements from a printed table.
One technique worth building into the unit: after completing a bar graph or pictograph worksheet, have students construct an intentionally wrong version of the same graph — a mismatched key, an inconsistent scale, a bar that doesn't reflect the data — then swap with a partner to find the error. Students who build a faulty graph must understand the structural rules well enough to violate them deliberately. That understanding shows up clearly on assessments.
Level-Based Adjustments for Different Learners
For students working below grade level on bar graphs, annotating the scale before they begin — marking each unlabeled gridline with its numeric value — narrows the working memory load during the comparison questions. Once the scale is fully labeled, students direct their attention to reading and comparing rather than splitting focus between interpreting the axis and solving the problem at the same time.
On-level students work through each worksheet independently. The question sequences move from reading individual values to multi-step comparisons to constructing a graph from a data table, so the difficulty progression is built in without requiring teacher check-ins at every step.
Above-level students get more from a follow-up task: after completing any graph worksheet, write two original "how many more/fewer" questions using the data on the page, trade with a partner, and solve each other's questions. Writing a valid comparison question requires knowing which values the graph actually supports and which comparisons produce a meaningful answer — that's a higher-order demand than anything the printed questions ask.
For fractional line plots, students who struggle with quarter-inch placement do better with a simplified reference: a paper number line marked only in quarter-inch increments, without the full set of ruler subdivisions. Using that reference for the first worksheet or two helps them internalize the spacing before returning to a standard ruler.
Frequently Asked Questions
Do the worksheets include answer keys?
Yes. Every worksheet in the set comes with a corresponding answer key. The bar graph and pictograph keys include computed values for each question, including two-step comparisons. The line plot keys show one correct version of the plotted data — if students measure actual classroom objects, their Xs may differ from the key, which is expected and worth a brief class discussion about measurement precision.
When in a unit should I introduce the scaled bar graph worksheets?
After at least one lesson where students have worked with a scale that jumps by intervals greater than 1. Students who encounter a scaled bar graph without that preparation frequently read every bar at face value, treating each gridline as if it represents one unit. A short whole-class experience — building a bar graph together from a class data set before the first independent worksheet — prevents that pattern from setting in.
Can students who haven't learned multiplication yet use the pictograph worksheets?
They can use repeated addition to work through them, but the process becomes slow on questions involving a key of 5 with eight or more symbols. Students without some fluency on 2s, 5s, and 10s spend most of their energy on the arithmetic rather than on interpreting the graph. Most teachers assign pictograph worksheets after students have had initial exposure to those fact families, even if full fluency isn't there yet.
How do the line plot worksheets connect to the fraction standards?
The line plot work in this 3rd grade graphing data worksheets set connects directly to CCSS.MATH.CONTENT.3.NF.A — specifically the expectation that students understand fractions like ¼ and ¾ as positions on a number line rather than just parts of a shape. When a student plots a measurement of ¾ inch on a line plot, they're applying that fraction number-line understanding in a measurement context. Teachers who time these worksheets to follow their fraction number-line lessons consistently report smoother student performance on both standards.