


Views
Downloads
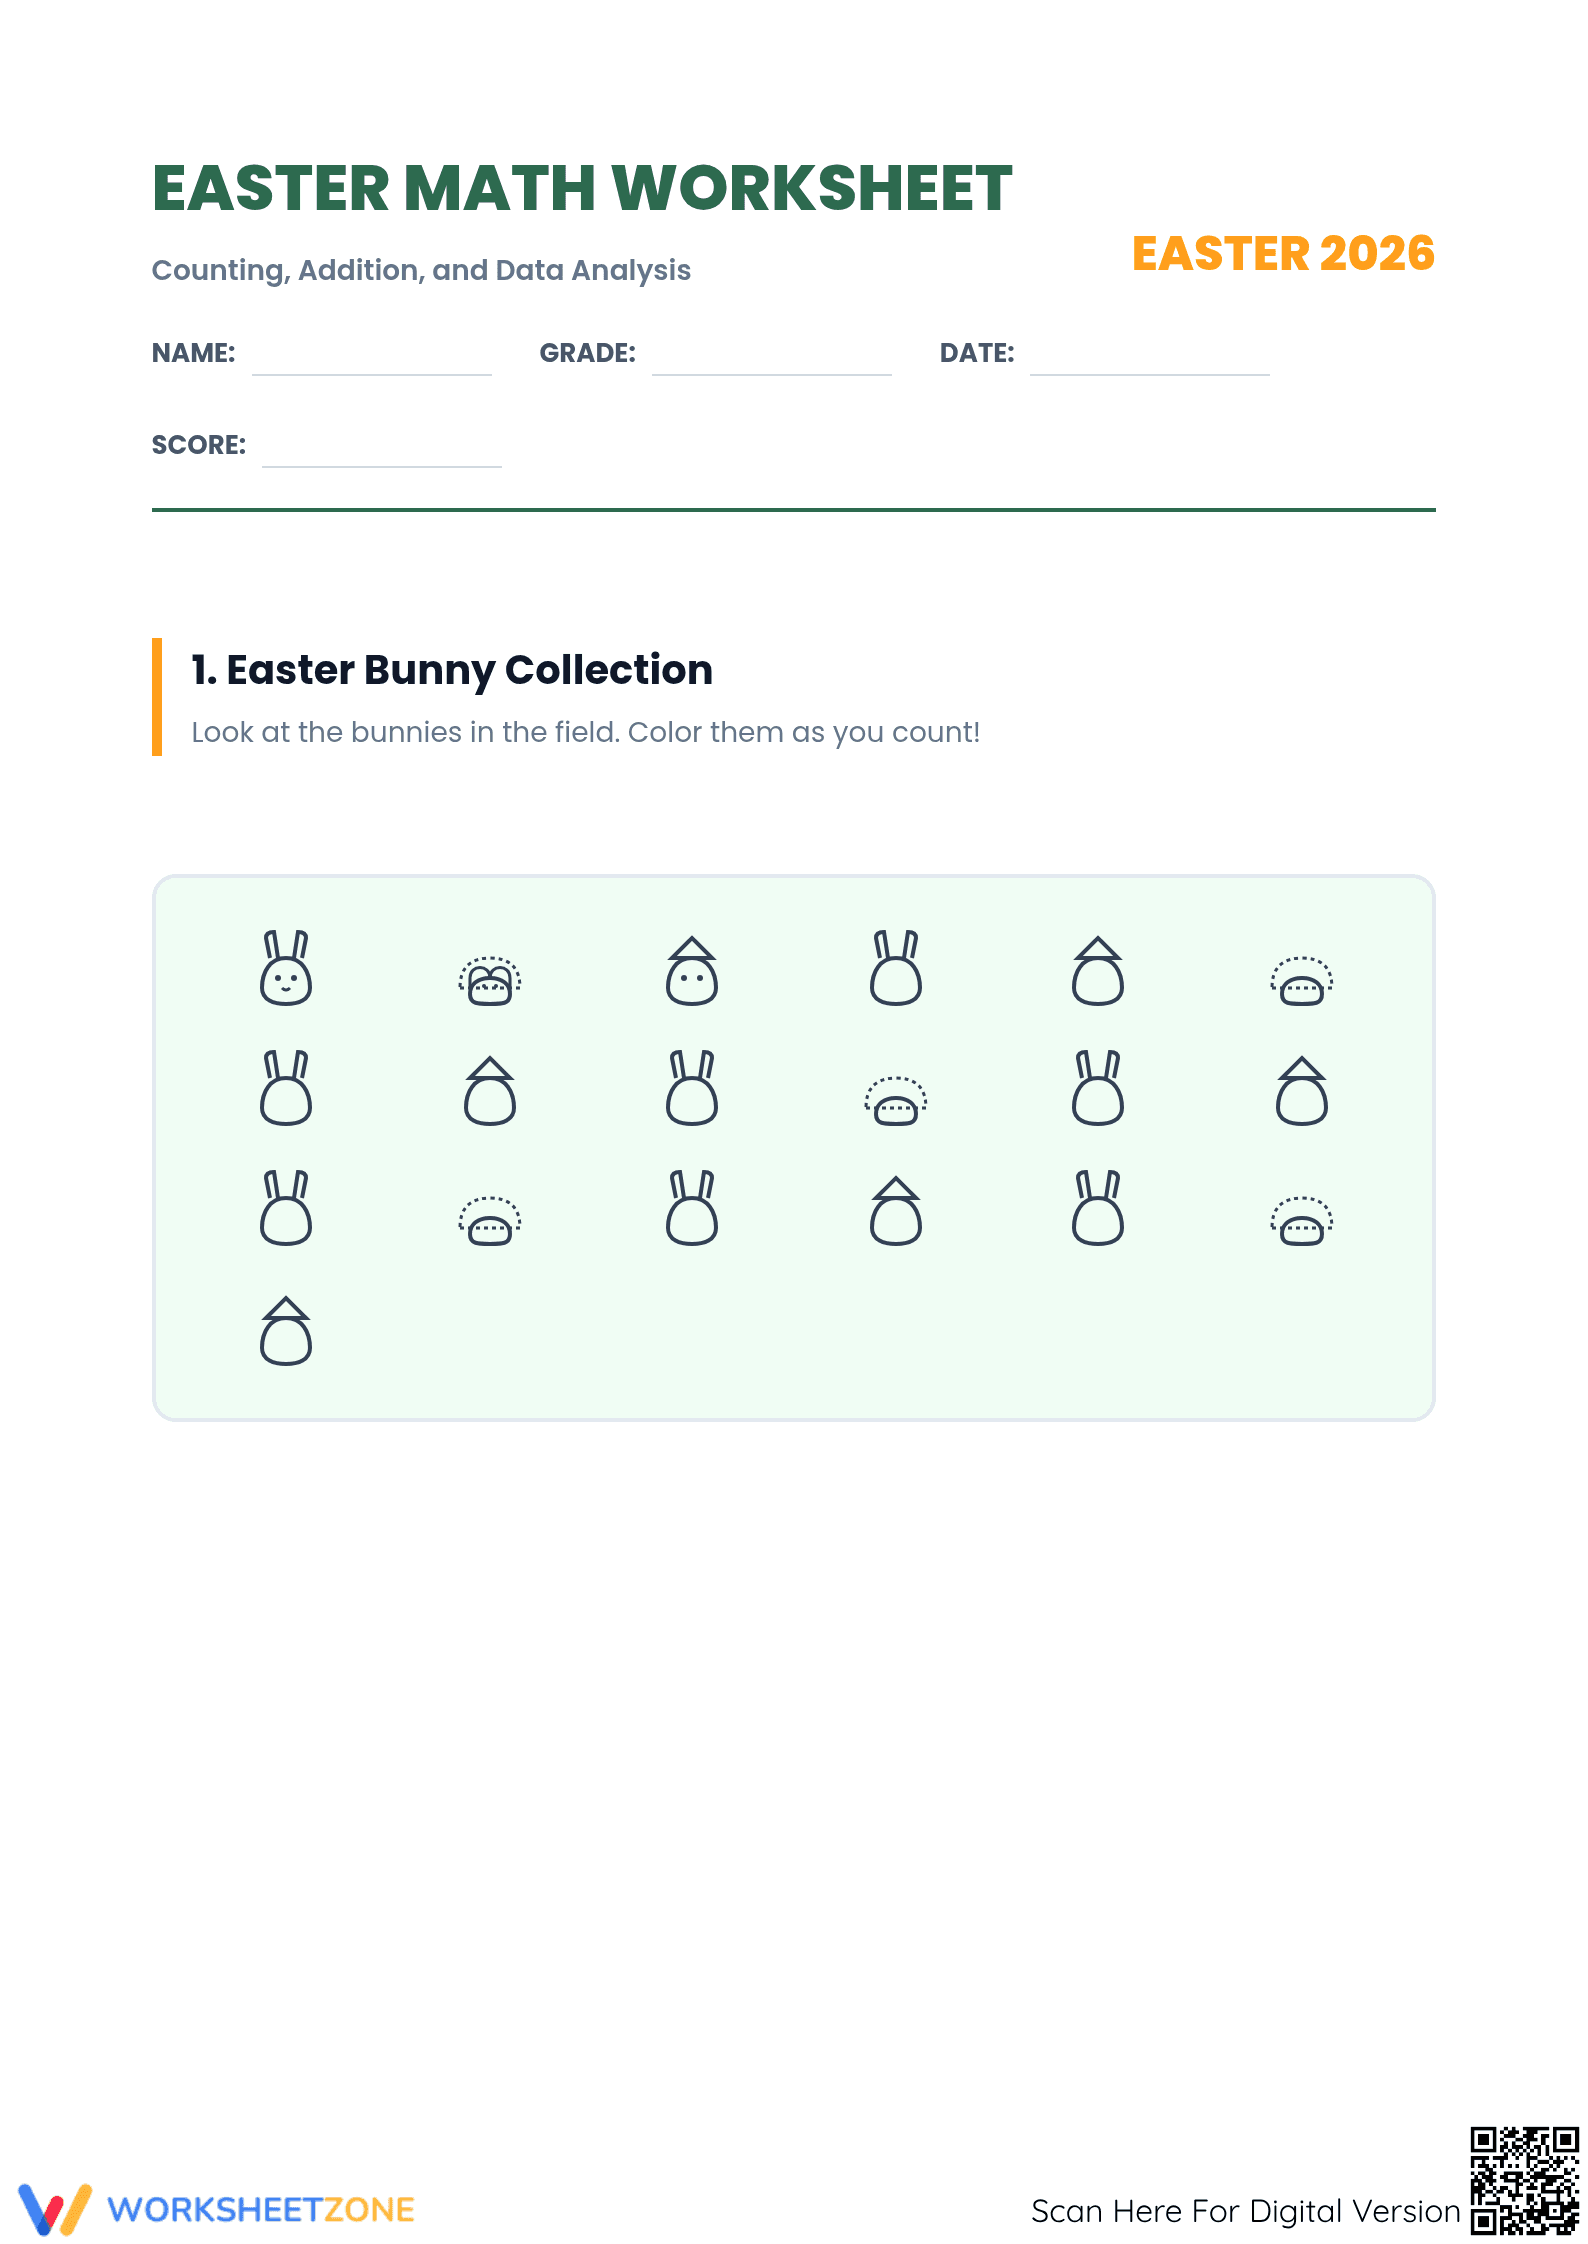
Grade 3 Easter Math — Printable No-Prep Worksheet
Paste this activity's link or code into your existing LMS (Google Classroom, Canvas, Teams, Schoology, Moodle, etc.).
Students can open and work on the activity right away, with no student login required.
You'll still be able to track student progress and results from your teacher account.
This Grade 3 Easter math worksheet provides students with an engaging way to practice counting, addition, and data analysis. By counting themed objects and transferring that data into a bar graph, learners build foundational skills in data representation while solving real-world comparative questions.
At a Glance
- Grade: 3 · Subject: Math
- Standard:
CCSS.MATH.CONTENT.3.MD.B.3— Draw a bar graph and solve problems using the data- Skill Focus: Graphing and Data Analysis
- Format: 3 pages · 5 tasks · Answer key included · PDF
- Best For: Independent practice or morning work
- Time: 15–20 minutes
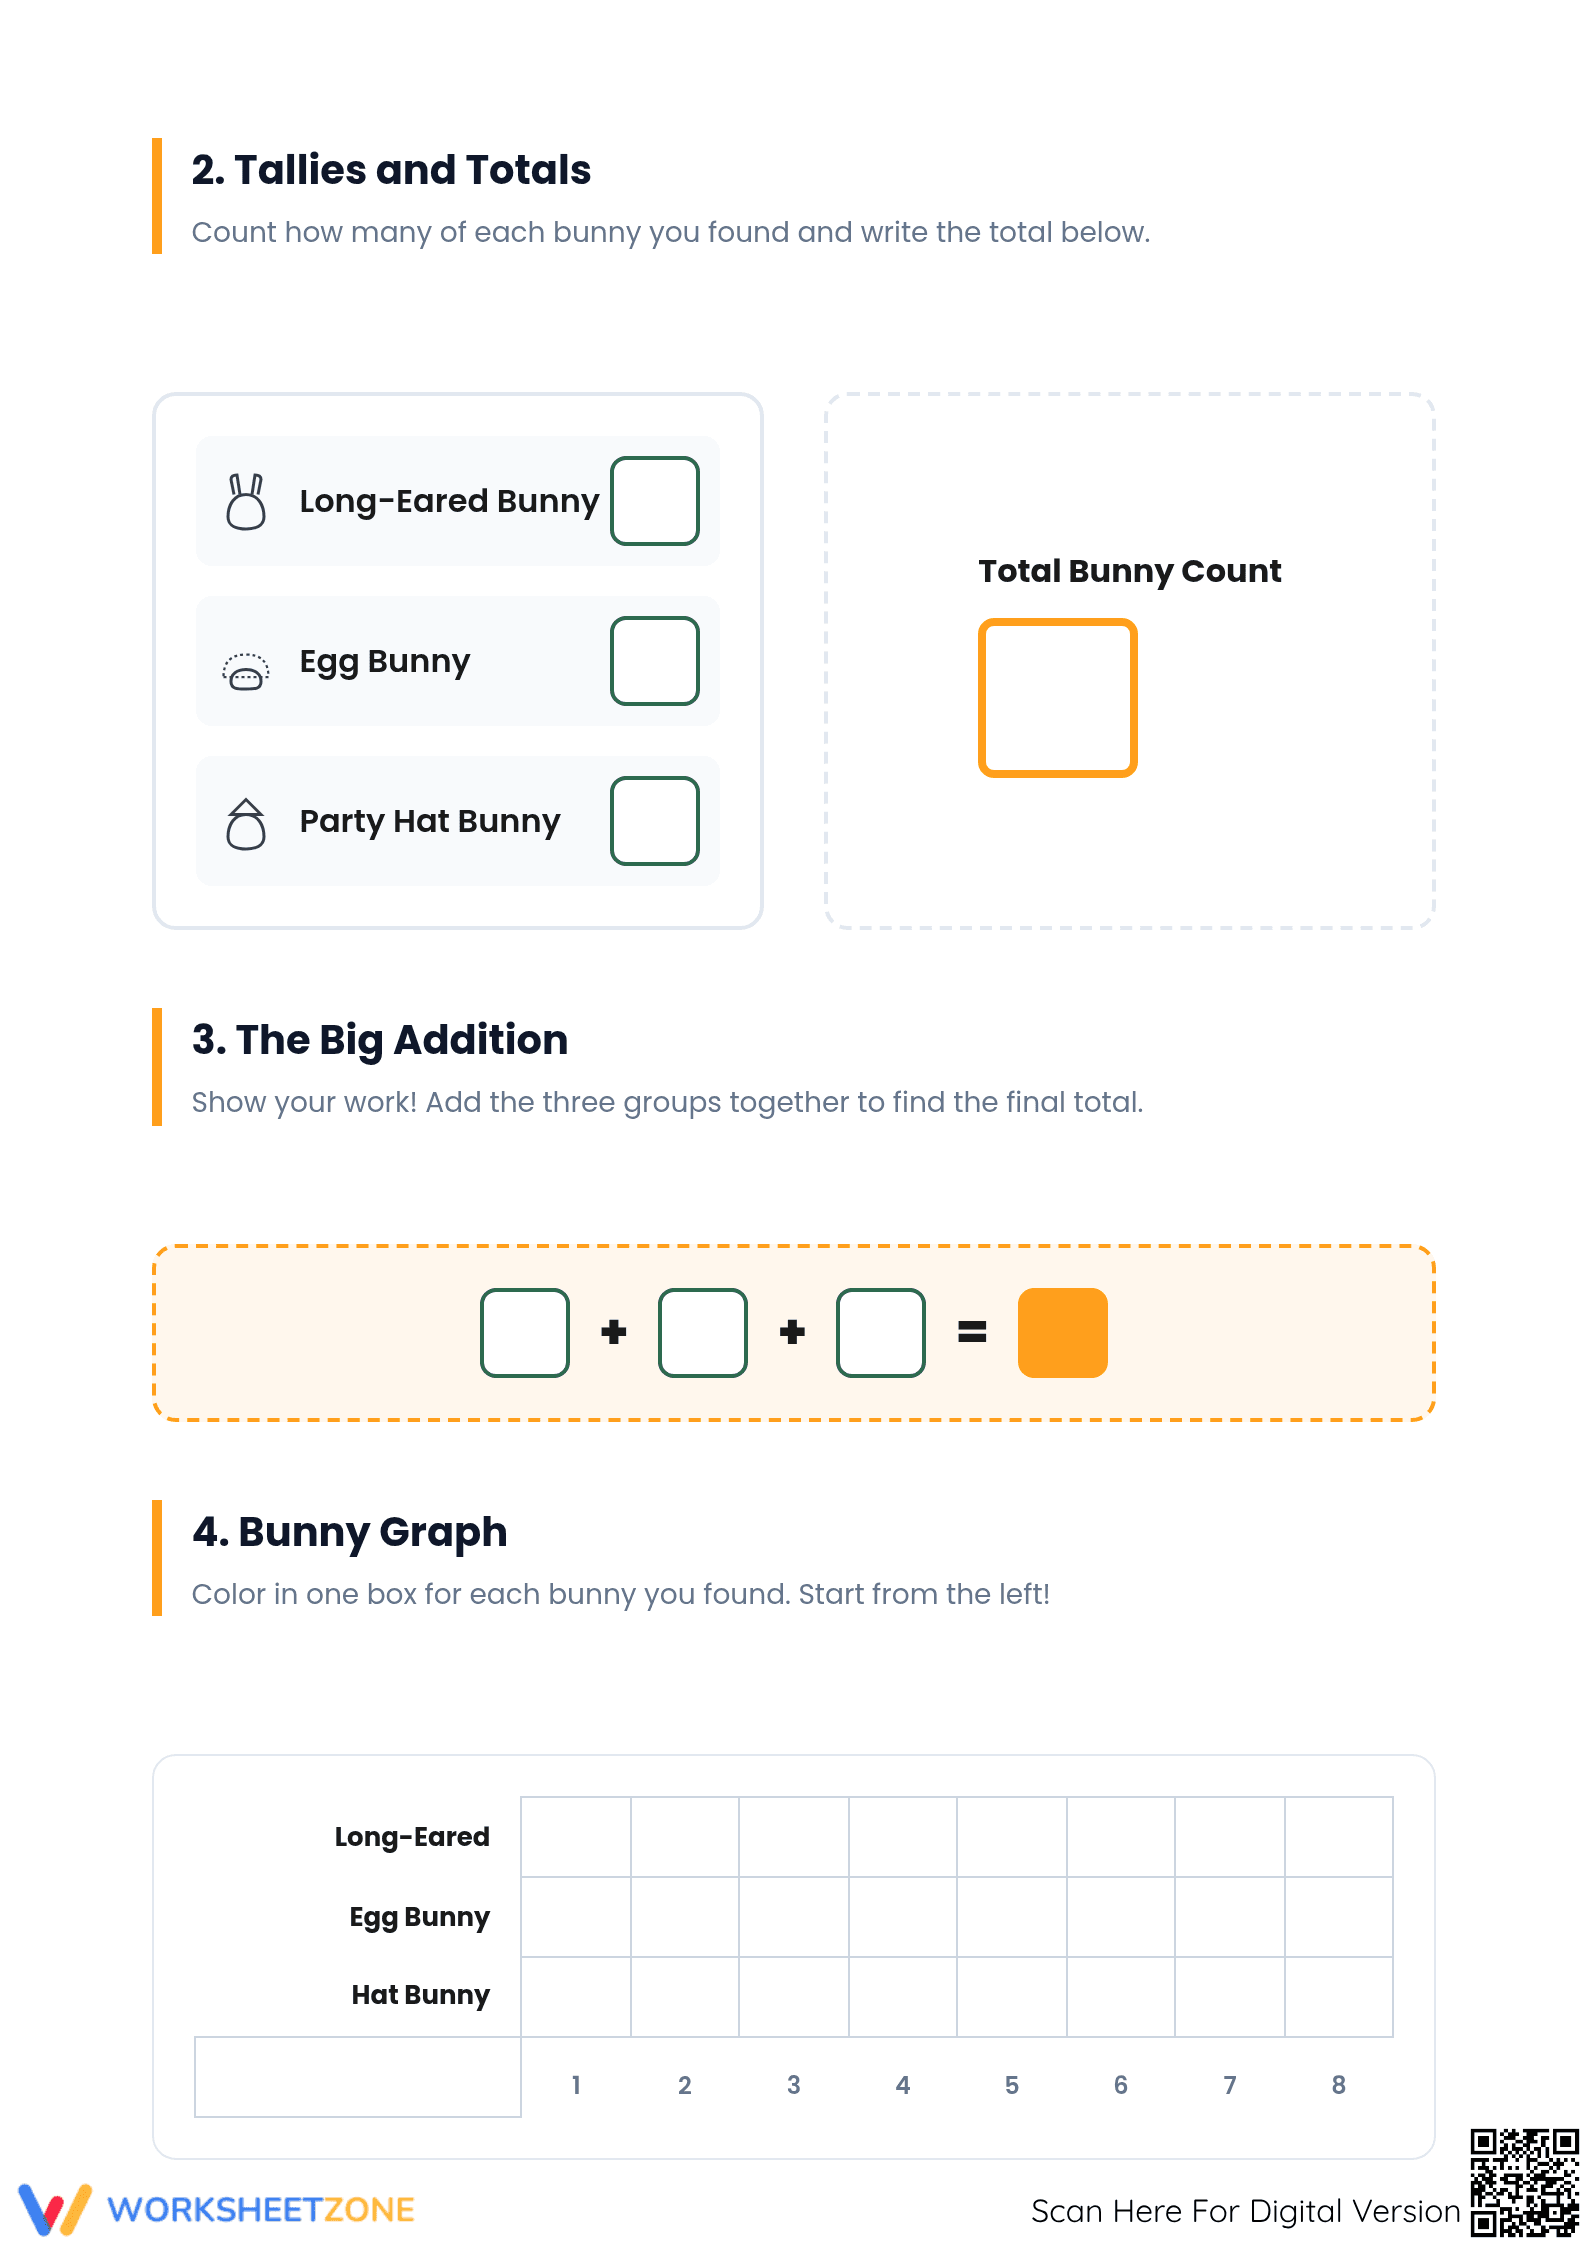
This comprehensive three-page packet includes five distinct task sections that guide students through the complete data lifecycle. Students begin by locating and counting specific Easter bunny characters in a mixed field, recording their tallies, and calculating a grand total using three-addend addition. Next, they translate their findings into a structured bar graph. Finally, a data discovery section challenges them to analyze their graph to determine maximums, minimums, and numerical differences. An answer key is provided for quick grading.
Designed for immediate classroom implementation, this resource follows a simple zero-prep workflow:
- Print (1 minute): Generate the three-page PDF and the accompanying answer key.
- Distribute (1 minute): Hand out the packets to students for independent or center-based work.
- Review (3 minutes): Use the provided answer key to quickly check student graphs and addition totals.
With under two minutes of total teacher prep time, this packet is an excellent option for emergency sub plans, holiday-themed math centers, or quiet morning work.
This activity is directly aligned to CCSS.MATH.CONTENT.3.MD.B.3, requiring students to draw a scaled bar graph to represent a data set with several categories and solve one- and two-step problems using information presented in the graphs. It also reinforces basic addition fluency. Both standard codes can be copied directly into lesson plans, IEP goals, or district curriculum mapping tools.
Teachers can utilize this worksheet during the spring season as a festive math center activity. It works exceptionally well as independent practice after a direct instruction lesson on reading and creating bar graphs. As a formative assessment tip, observe how students transition their raw counts into the bar graph; check if they are accurately aligning their shaded boxes with the correct numerical axis. The entire activity should take most students between 15 and 20 minutes to complete.
This resource is primarily designed for third-grade students developing their data analysis and graphing skills. It can also serve as a helpful review for fourth graders or an enrichment activity for advanced second graders. For students who need extra support, teachers can provide physical manipulatives to help them count the bunnies before coloring the graph. This worksheet pairs perfectly with introductory lessons on data collection or seasonal anchor charts about graphing.
Integrating thematic elements into mathematical practice can significantly enhance student engagement and knowledge retention during holiday seasons. This worksheet aligns with CCSS.MATH.CONTENT.3.MD.B.3, focusing on the essential skill to draw a bar graph and solve problems using the data. According to a ScienceDirect TpT Analysis, contextualizing abstract mathematical concepts—such as data collection and graphical representation—within familiar, engaging themes helps lower affective filters and encourages active participation. By requiring students to physically count objects, record tallies, and construct their own bar graphs, this resource bridges the gap between concrete counting and abstract data analysis. The structured progression from raw data collection to comparative analysis ensures that learners actively interpret mathematical relationships. This targeted practice supports long-term proficiency in elementary statistics and foundational problem-solving.