3rd Grade Line Plots printable worksheets
These 3rd grade line plots printable worksheets give students direct, repeated practice with one of the more nuanced data tasks in the third-grade math year: constructing and reading line plots built around measurement data that includes half- and quarter-inch intervals. Each worksheet uses a distinct collection context — pencil lengths, ribbon pieces, seedling heights — so students apply the same core skill across varied situations rather than memorizing a single procedure. Teachers get resources that slot into math centers, end-of-lesson exit tickets, or targeted review after a whole-group introduction.
The Specific Skills Targeted
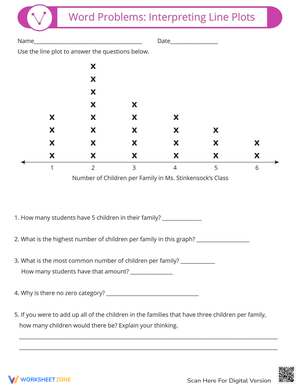
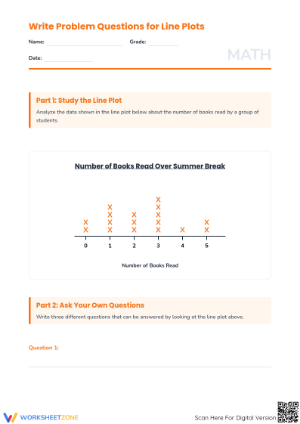
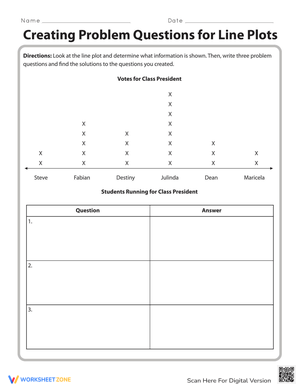
The set covers the full range of what the standard asks. On some worksheets, students receive a completed data table and build the line plot from scratch — deciding where the number line begins and ends, marking appropriate intervals, and placing each X above the correct value. On others, students receive a finished line plot and answer a short set of interpretation questions:
- How many total objects were measured?
- Which measurement appeared most frequently?
- What is the difference between the greatest and least values?
- How many objects measured greater than a given value?
Several worksheets ask students to mark fractional intervals — halves and quarters — on the number line before plotting, which surfaces a distinct skill from simply reading a pre-labeled axis. A few include short measuring tasks where students record lengths of classroom objects and transfer that data to a line plot, making the connection between using a ruler and representing data concrete rather than assumed.
Student Errors Worth Anticipating Before the Lesson
The most persistent error isn't misreading fractions — it's uneven spacing on the number line. Students often compress fractional intervals while keeping whole-number intervals wide, placing 1/4 very close to 0 and 3/4 very close to 1. The result looks roughly plausible at a glance, but distorted spacing misrepresents the data's distribution. Having students use the pre-printed grid marks on each worksheet before drawing freehand helps them internalize what equal interval spacing looks like in practice.
A second error involves what X marks represent. Third graders new to line plots frequently read three X marks above "2 inches" as the value 2 rather than recognizing three separate objects that each measure 2 inches. They're reading position rather than count — a conceptual gap that surfaces reliably on any worksheet asking "how many objects measured exactly 2 inches?" Requiring students to write the count of X marks above each label before answering interpretation questions catches this quickly.
A smaller but consistent problem is skipping data points. A student working through a twelve-item list will often omit two or three entries, then become confused when the total count doesn't match. Teaching students to cross off each value in the data list as they place the corresponding X on the plot nearly eliminates this, and explaining the habit takes about thirty seconds.
Standard Alignment
These worksheets align with CCSS 3.MD.B.4, which asks students to generate measurement data by measuring lengths to the nearest half or quarter inch and represent that data on a line plot with a horizontal scale marked in whole numbers, halves, or quarters. In classroom terms, this standard sits at the intersection of two skill threads — ruler measurement and data representation — which is why it often surprises teachers during unit planning. Students who measure confidently to the nearest inch may still struggle when a number line requires placing 3/4 between 1/2 and 1. The 3rd grade line plots printable worksheets in this set address both threads explicitly rather than assuming students transfer one skill to the other automatically.
Where These Worksheets Fit Best in Your Lesson Plans
The strongest placement for these resources is the 15 minutes directly after a whole-group demonstration of plotting procedure. At that point, students have a working model of the steps but haven't practiced independently — the worksheets let them consolidate the process before the sequence fades from working memory. For math centers, pairing a measuring station with an adjacent plotting station creates a natural two-step flow: students record lengths at the first table, then carry their data strip to the next and build the line plot. That physical transition from collecting to representing mirrors what the standard actually asks students to do.
Using 3rd grade line plots printable worksheets as Monday warm-up openers — after a weekend gap — keeps the skill active without requiring full re-teaching. Eight minutes on a familiar context rebuilds fluency reliably. For end-of-unit assessment, select a worksheet that requires students to construct a line plot from raw data and answer three interpretation questions. That pairing gives a much clearer picture of each student's understanding than a construction task alone.
Adjusting These Worksheets for Students at Different Levels
For students still building confidence with fractional number lines, start with worksheets that have the intervals pre-labeled — the number line is drawn, halves and quarters are already marked, and the task is placing X marks from a data list. That reduction in cognitive load lets students focus on the plotting act itself rather than splitting attention between fraction placement and data representation simultaneously.
Students who finish quickly benefit from an added interpretation layer: ask them to write two observations about the data that go beyond direct reading — something inferred, like why measurements cluster near a particular value, or what would change if three more data points shifted the pattern. For English language learners, labeling the title line, horizontal axis, and X marks in both English and the student's home language before starting keeps the mathematical task in focus and reduces the barrier of unfamiliar vocabulary.
Frequently Asked Questions
What Common Core standard do these worksheets address?
CCSS 3.MD.B.4 — the standard requires students to generate measurement data by measuring lengths with rulers marked with halves and fourths of an inch, then display that data on a line plot. The horizontal scale must be marked in appropriate units: whole numbers, halves, or quarters.
Do students need prior ruler experience before using these worksheets?
Several worksheets provide data tables that are already filled in, so students focus only on plotting. Others include a short measuring task. For classes that haven't covered ruler measurement yet, use the data-table worksheets first and hold the measuring worksheets until after that unit is complete.
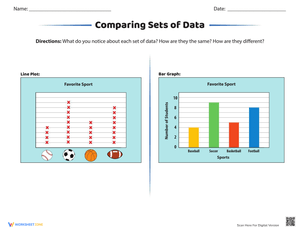
How do line plots differ from bar graphs at this grade level?
Bar graphs display categories — types of pets, favorite seasons. A line plot displays numerical data along a continuous number line, which makes it the right tool when measurement values fall on a scale with fractional positions rather than in discrete, named bins. Third graders work with both formats, but line plots are specifically called for when measurement data includes halves or quarter-inch values.
Can these worksheets serve as formative assessment?
3rd grade line plots printable worksheets work well as formative checkpoints, particularly as exit tickets at the close of a lesson. A single worksheet asking students to plot a six-item data set and answer two questions takes about ten minutes and reveals clearly which students grasp frequency counts, which are misreading fractional positions, and which are still skipping data points during construction.
Clear All