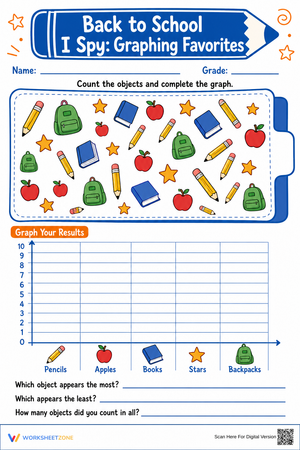
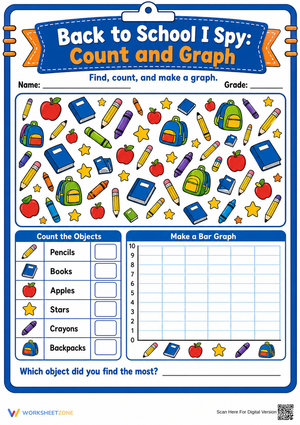
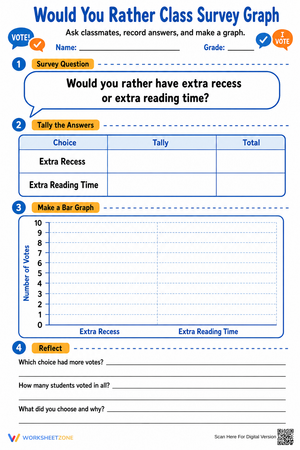
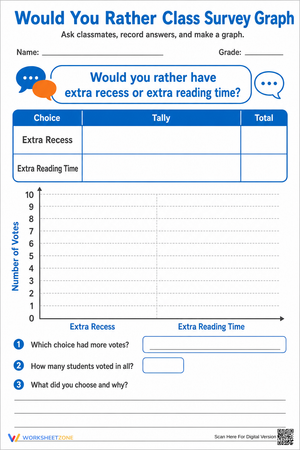
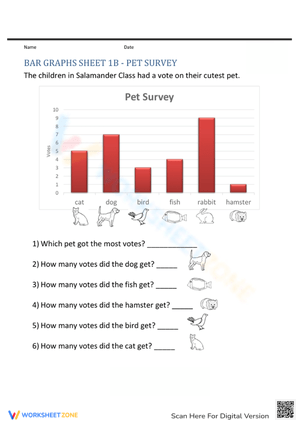
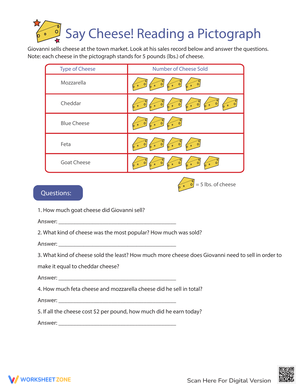
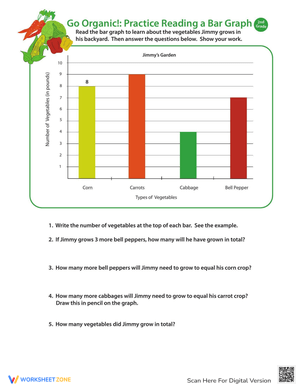
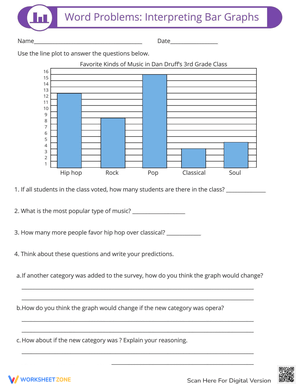
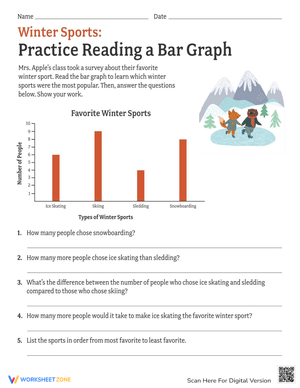
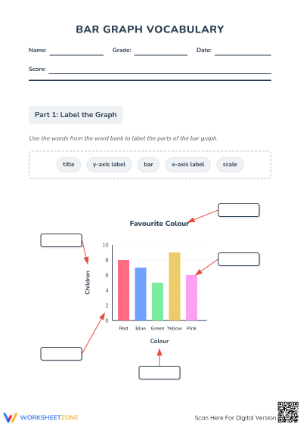
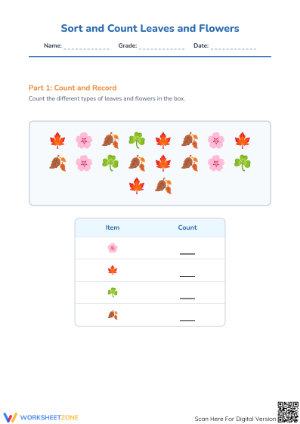
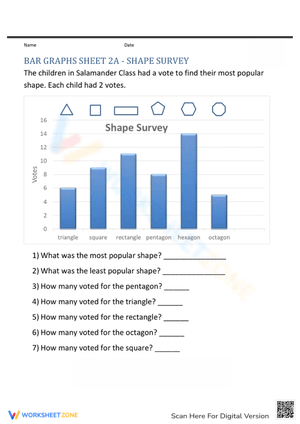
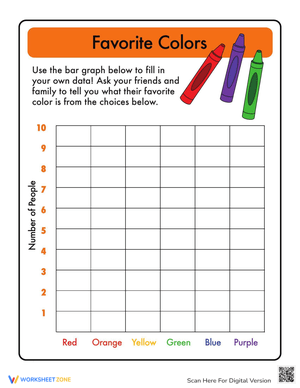
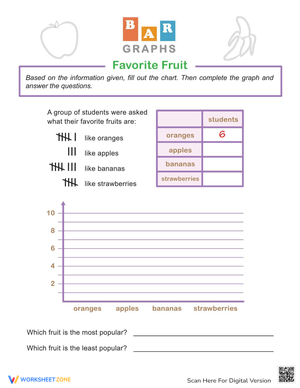
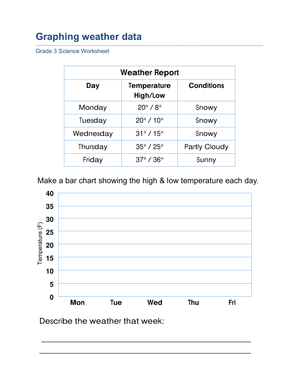
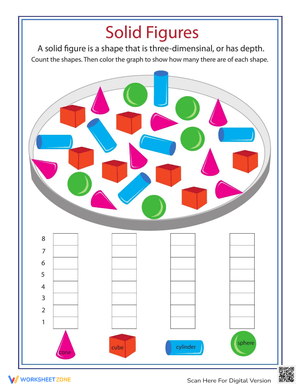
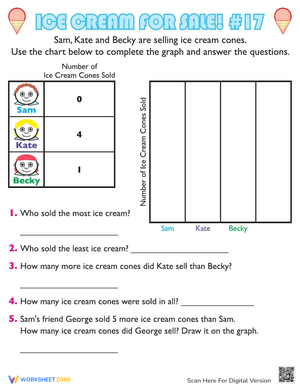
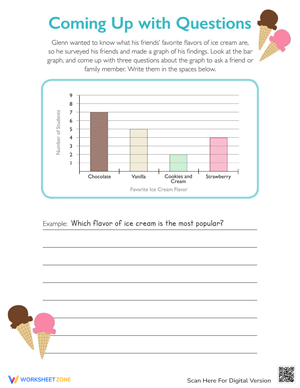
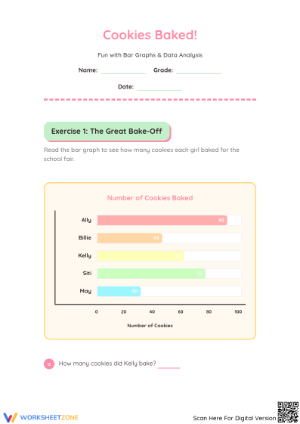
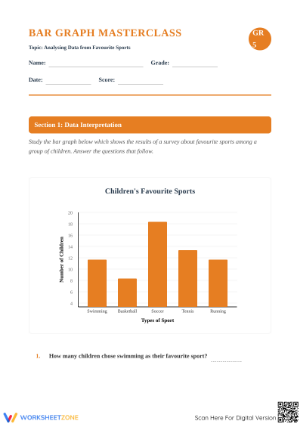
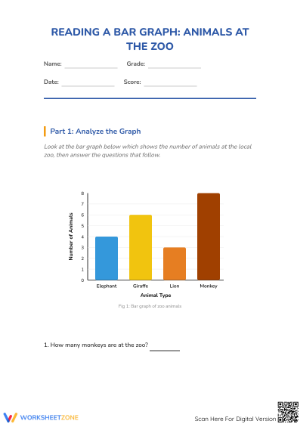
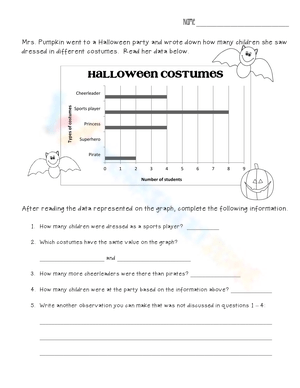
These bar graphs printable worksheets for 3rd grade target the specific shift that defines the 3.MD.B.3 standard: the move from one-to-one counting graphs to scaled graphs where each interval represents 2, 5, or 10 units. The set covers both reading and constructing graphs, so teachers get practice for both directions of the skill before an assessment.
What's Inside the Set
Each worksheet isolates a distinct slice of the bar graph skill set rather than cycling through the same surface-level tasks. Across the set, students work through these operations:
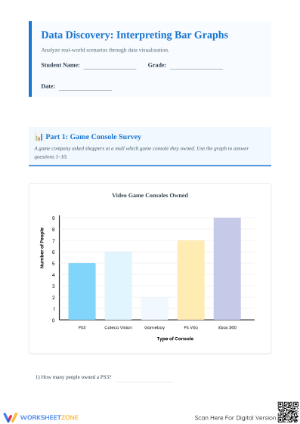
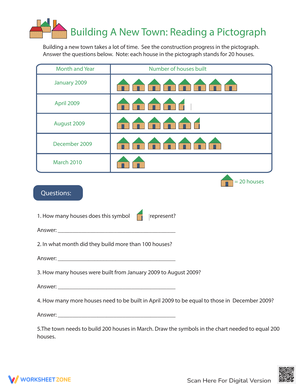
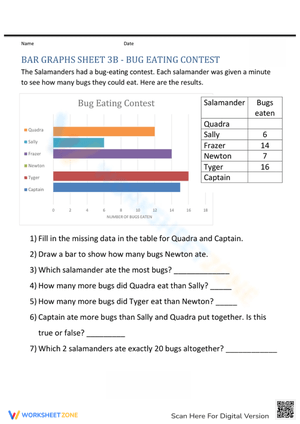
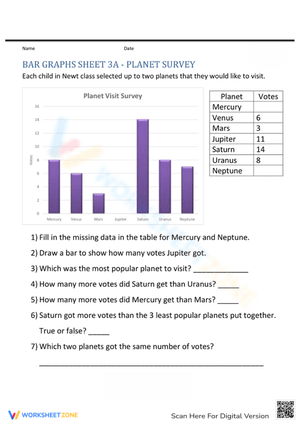
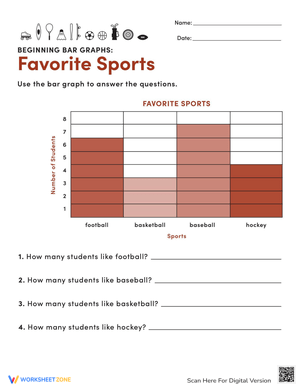
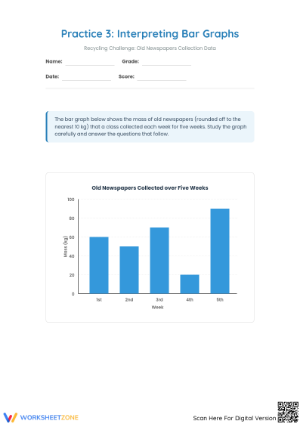
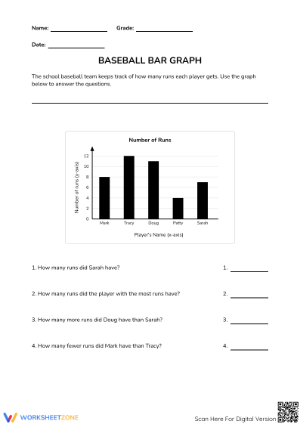
- Read a scaled bar graph and record exact values, including bars that land between labeled intervals
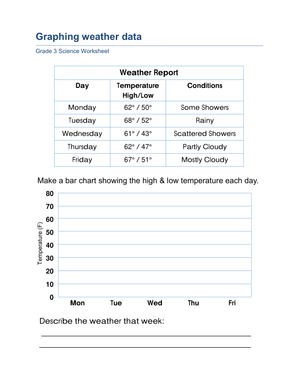
- Construct bars from a given data table, then supply a title and axis labels from scratch
- Answer one-step comparison questions ("Which category had the fewest responses?") and two-step problems ("How many more students chose science than history and art combined?")
- Identify what scale a graph uses before answering any questions — a deliberate first step that forces students to check the interval rather than assume it
- Choose a scale independently when given only a data table and a blank grid
The two-step comparison questions deserve particular attention. That's where students most often lose points on assessments — not because they can't read a bar, but because they rush the arithmetic after reading it correctly.
Scale Reading: The Core Difficulty at This Grade
In second grade, one square on a graph equals one item. In third grade, that relationship breaks. A bar sitting on the "6" line of a graph that counts by 5s doesn't represent 6 items — it represents 30. That is not intuitive for an 8-year-old who spent the previous year reading graphs by counting squares. The mental adjustment requires applying multiplication to a visual, which is genuinely new cognitive territory.
These worksheets vary the scale across the set — some count by 2s, some by 5s, some by 10s — so students cannot develop a single pattern-matching habit. A few worksheets also use scales that count by 4s, which appear occasionally on state assessments and reveal whether students are truly reading the interval or just recognizing a familiar skip-count sequence.
Frequent Student Errors Worth Watching For
The bar graphs printable worksheets for 3rd grade in this set are built to surface specific errors, not just provide repetition. The most persistent problem at this level: treating any scale as 1:1. A student who sees a bar at the "4" mark of a graph where each interval equals 5 writes "4" on the answer line, not "20." This appears in student work far more than teachers expect — even in classrooms where scaled intervals were explicitly taught the previous week. Worksheets that place two graphs side by side, one with a scale of 2 and one with a scale of 10, slow students down and force a deliberate comparison before any bars are read.
A second reliable error: bars that represent values between labeled marks. If a scale counts by 10s and a value is 35, the bar should land halfway between the 30 and 40 marks. Many students draw it flush with one or the other. Worksheets that ask for a written numerical answer — not just a colored bar — require students to commit to a specific number, which is where this error becomes visible and correctable.
The third pattern: students who read all bars correctly but subtract in the wrong direction on "how many more" questions. A student looking at bars for 40 and 25 sometimes writes 15, sometimes 65. The addition error is a sign the question type hasn't been internalized yet — they see "more" and add rather than subtract. Catching it early matters because it compounds across the entire comparison problem type.
How to Build These Worksheets Into Your Lesson Plans
The construction worksheets — where students draw bars from a data table — land best after at least two sessions of reading-only practice. Asking students to build before they can accurately read inverts the skill order. Once they're reading scaled graphs with confidence, construction becomes a natural extension: they understand why scale matters because they've depended on it to extract information.
Monday warm-ups are a reliable slot for this material. A single reading worksheet takes 8 to 10 minutes before the main lesson begins, and using topics connected to real classroom data — a weekend survey, a lunch preference tally — sharpens attention in a way that generic "favorite animals" themes don't. Students pay much closer attention to scale when they have a stake in what the bars represent.
For a Friday assessment block, one construction worksheet plus two comparison questions makes a clean 15-minute formative task. It separates students who can read a scale but can't yet build one from students who have consolidated both skills — exactly the information needed to plan the following week.
Standard Alignment
CCSS.MATH.CONTENT.3.MD.B.3 calls for students to draw scaled bar graphs representing data sets with several categories, then solve one- and two-step "how many more" and "how many less" problems using the information presented. The bar graphs printable worksheets for 3rd grade in this set address both halves of that standard — construction and interpretation — because assessments test both. Teachers who rely on reading-only practice routinely find students struggling on constructed-response items where they must supply scale, labels, and bars without a model in front of them.
The standard sits inside the Measurement and Data domain and connects directly to the multiplication work happening in the same unit. When students determine that a bar at the 6th interval of a scale-of-5 graph represents 30 items, they're applying 6 × 5 in a context that feels immediate. That connection is worth making explicit during instruction rather than leaving it implicit.
Adapting These Worksheets for Different Student Levels
For students still building confidence with scaled intervals, start with worksheets that have the scale, axis labels, and title already printed. Their job is limited to drawing accurate bars and answering the questions — one layer of complexity at a time. A useful next step: have them cover the pre-printed scale with a sticky note, write in their own scale choice, then uncover and compare. It introduces the decision-making process without the pressure of a blank page.
Students who are ready for extension get the most out of blank-grid worksheets where they supply every element — title, both axis labels, and scale. Push further by asking them to graph the same data set twice using two different scales, then write a sentence explaining which version communicates the data more clearly. That task requires proportional reasoning well beyond grade-level expectations, but it reveals genuine mathematical thinking in students who are ready for it. The bar graphs printable worksheets for 3rd grade in blank-grid format are the right vehicle for this kind of extension because there are no pre-printed constraints to work around.
For students who read bars accurately but consistently stumble on comparison word problems, isolate the question type. Let them use a number line alongside the worksheet as a temporary support — not a permanent one — that keeps arithmetic errors from obscuring the data-reading skill actually being assessed. The goal is to distinguish "can this student read the graph?" from "can this student subtract fluently?" until both are solid on their own terms.
Frequently Asked Questions
My students learned picture graphs last year. Will the switch to bar graphs be difficult?
The graph type itself isn't the main hurdle — the scaled intervals are. Students who handled picture graphs in second grade already understand counting to find a value. What's new in third grade is that the counting uses multiplication rather than 1:1 correspondence. If students can skip-count by 2s, 5s, and 10s with reasonable fluency, the transition to bar graphs is manageable. The students who struggle are usually those who haven't consolidated skip-count sequences yet, not those who are confused by bars versus icons.
What should I do when a student draws bars that don't align with any scale line?
This almost always means the student chose a scale that doesn't fit the data range — a common problem when students first select their own scales. If the highest data value is 48 and a student chose a scale of 3, the bar for 48 lands between the 45 and 48 marks with no clear stopping point. Having students test a scale by asking "can every value in my data land exactly on a scale line?" before drawing saves a significant amount of erasing. Running through that check with the whole class on one example tends to fix the problem faster than addressing it student by student after the fact.
How do the two-step problems in the set work?
The two-step problems ask students to read two or more bars, combine or compare those values, and then perform a second operation — for instance, find the total for two categories, then compare that total to a third. Students often complete the first read correctly and then lose track of what the question is actually asking. A classroom habit worth building: underline the question before touching the graph. That simple move reduces this specific error more reliably than reteaching the arithmetic involved.













 Interactive Worksheet Maker
 Quiz Maker
 Word Search Maker
 Crossword Puzzle Maker
 Word Scramble Generator
 Sentence Scramble Generator
 Handwriting Worksheet Generator
 Name Tracing Generator
 Fill In The Blank Generator