These scaled bar graphs worksheets for 3rd grade capture a specific turning point in elementary math — the shift from one-to-one graphs, where every square means exactly one unit, to axes that skip-count by twos, fives, or tens. That conceptual move sounds small until you watch a third grader confidently count individual grid boxes on a scale-of-five graph and land on the wrong answer with complete confidence. These worksheets build the targeted practice that closes that gap.
What Students Practice Across the Set
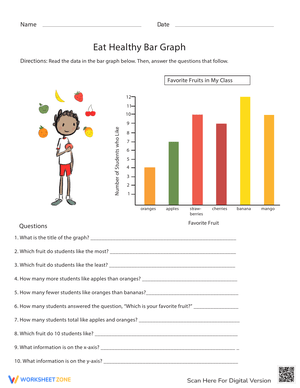
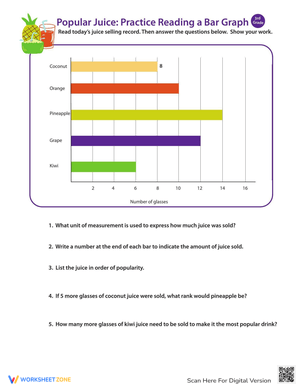
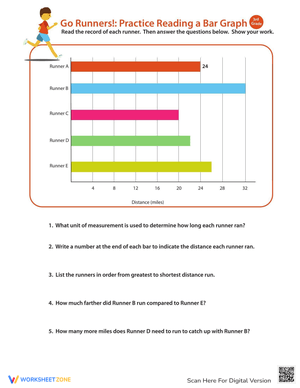
Each worksheet targets one or more of the skills that 3.MD.B.3 requires students to demonstrate by the end of third grade. The set covers both vertical and horizontal bar graphs, because students who practice only one orientation will freeze when the axis flips on a unit test or state assessment. The core tasks across the set include:
- Identifying the scale interval before reading any bars — by twos, fives, or tens
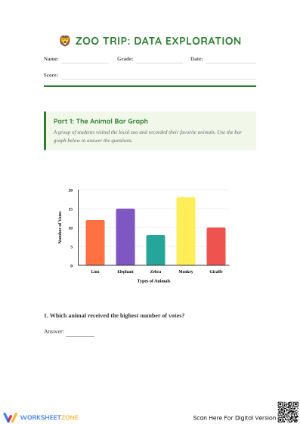
- Reading bars that land exactly on a labeled gridline
- Reading bars that stop between two gridlines, the skill that most reliably separates confident graphers from students who are guessing
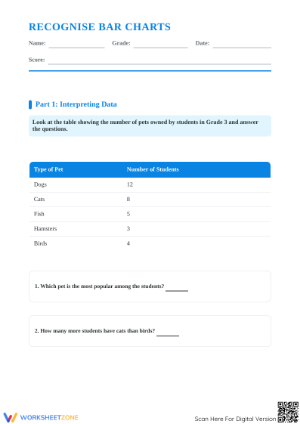
- Solving one-step and two-step comparison problems: "how many more" and "how many fewer"
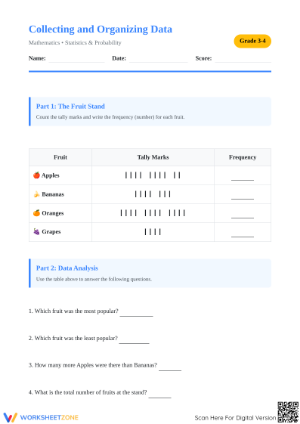
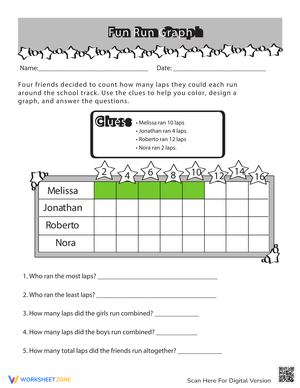
- Constructing a bar graph from a raw data table, including selecting an appropriate scale
The construction worksheets ask students to plan their scale before they draw anything. That is a different cognitive task than reading a pre-built graph. When students decide whether a scale of five or ten better fits a data set with values like 7, 13, and 22 — numbers that don't divide evenly by either — they are reasoning about representation, not just decoding it.
Frequent Errors Worth Anticipating Before Lesson Day
The most stubborn reading error involves bars that end between two gridlines. On a scale counting by fives, a bar stopping halfway between 15 and 20 will produce "15" from the majority of students on the first attempt. They anchor to the labeled line below and stop reasoning. The fix is explicit: teach students to name both bracketing values before they determine what sits between them. Skipping that step and hoping for transfer does not work in most third-grade classrooms.
A second error shows up consistently in comparison problems. Students who correctly read that one bar shows 14 and another shows 6 will still write "14" when asked how many more the taller bar represents — they answer the simpler question (what is the value?) rather than the actual question (what is the difference?). Catching this during a quick class share-out before students pack up is far more efficient than reteaching it the following week. Having students write both bar values in a small box before they subtract makes the two-step structure visible and reduces this error noticeably within a few practice sessions.
Building These Worksheets Into Your Weekly Lesson Plans
The most effective use of the set treats the worksheets as a deliberate progression rather than interchangeable daily practice. Open with the scale-of-two worksheets in a whole-group setting — project one on the board and think aloud through the scale-identification step before touching any bars. That five-minute model, especially when this is new content, gives students the language ("the scale counts by twos, so each gridline adds two") they will use independently and in pair work later. Once that language is established, the reading worksheets work well at a math center, where pairs can check each other on the between-gridline bars.
For the construction worksheets, build in time for students to compare the scales they chose. One student's scale-of-five graph and another's scale-of-ten graph of the same data set generates a genuine discussion about what changes (the bar heights) and what stays true (the data itself). Reserve one fresh worksheet per student for the end of the unit — it gives a clean individual snapshot of mastery without requiring a separate printed test.
Standard Alignment
CCSS 3.MD.B.3 (Measurement and Data) sits in the third-grade curriculum alongside multiplication and division — not by coincidence. Reading a scale-of-ten graph is skip-counting by tens with a purpose; finding the difference between two bars is subtraction with a context. The standard requires students to both draw scaled bar graphs and use them to solve one- and two-step problems focused specifically on "how many more" and "how many fewer" questions. The scaled bar graphs worksheets for 3rd grade address both requirements — the visual interpretation tasks and the arithmetic reasoning tasks — so teachers cover the full standard without needing separate materials for each half.
Adjusting the Set for a Range of Learners
Students who are still unsteady on skip-counting benefit from starting with worksheets where every bar lands exactly on a labeled gridline and the scale counts by twos. Hold off the between-gridline challenge until skip-counting itself is automatic. A number line posted at the student's workspace, labeled by twos or fives to match the graph's scale, provides concrete support without reducing the reasoning demand of the task itself.
On-level students work through the full set as intended, moving from scale-of-two to scale-of-five to scale-of-ten across both bar graph orientations. Students who move quickly through the reading tasks gain more from the construction worksheets — and from being asked to select their own scale before drawing. The scaled bar graphs worksheets for 3rd grade include data sets with values that don't divide evenly by five or ten, which creates productive friction for students who are ready to reason about scale tradeoffs rather than defaulting to the nearest familiar multiple.
Frequently Asked Questions
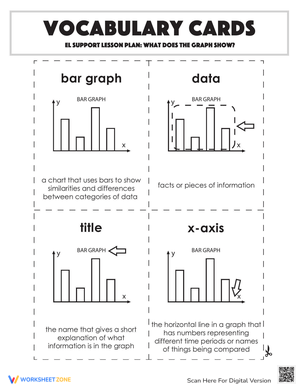
What makes a bar graph "scaled" and why is it introduced in third grade specifically?
A scaled bar graph uses axis intervals greater than one — counting by twos, fives, or tens rather than marking every single unit. Third grade is the right placement because students are actively building multiplication and skip-counting fluency at that level, and reading a scale-of-five graph is essentially skip-counting with a visual anchor. The K–2 curriculum uses one-to-one correspondence deliberately, so the move to scaled graphs represents genuine conceptual growth, not just a procedural variation on familiar work.
Which scale intervals should students encounter first?
Start with twos. Skip-counting by twos is typically the most automatic for third graders, which keeps cognitive load manageable while students learn the mechanics of reading between gridlines. Fives come next — familiar from counting nickels and reading analog clocks — and tens follow. Introducing the three intervals in that order means students are never decoding an unfamiliar scale and reading the graph's data at the same time. The scaled bar graphs worksheets for 3rd grade are sequenced with scale-of-two tasks appearing early and scale-of-ten tasks appearing later in the set.
How do I address students who read bars accurately but still miss comparison problems?
This disconnect is common in third-grade data work. Students correctly identify that one bar shows 18 and another shows 10, then write "18" in response to "how many more." The issue is that they answer the simpler embedded question instead of the actual one. Have those students write both values — circled or boxed — before they attempt any subtraction. Making the two-step structure physically visible, rather than asking them to hold it in working memory while also computing, resolves the pattern for most students within a few practice sessions.
Do these worksheets include both horizontal and vertical bar graphs?
Yes. Each orientation gets specific practice rather than assuming transfer. Students who only see vertical bar graphs will often second-guess themselves — or rotate their paper — when the scale shifts to the horizontal axis. Direct, early exposure to both formats is more reliable than expecting students to carry over their reading strategy independently when the layout changes.


 BACK TOSCHOOL