


Views
Downloads
Reading Circle Graphs Worksheet | Grade 4 Essential
Paste this activity's link or code into your existing LMS (Google Classroom, Canvas, Teams, Schoology, Moodle, etc.).
Students can open and work on the activity right away, with no student login required.
You'll still be able to track student progress and results from your teacher account.
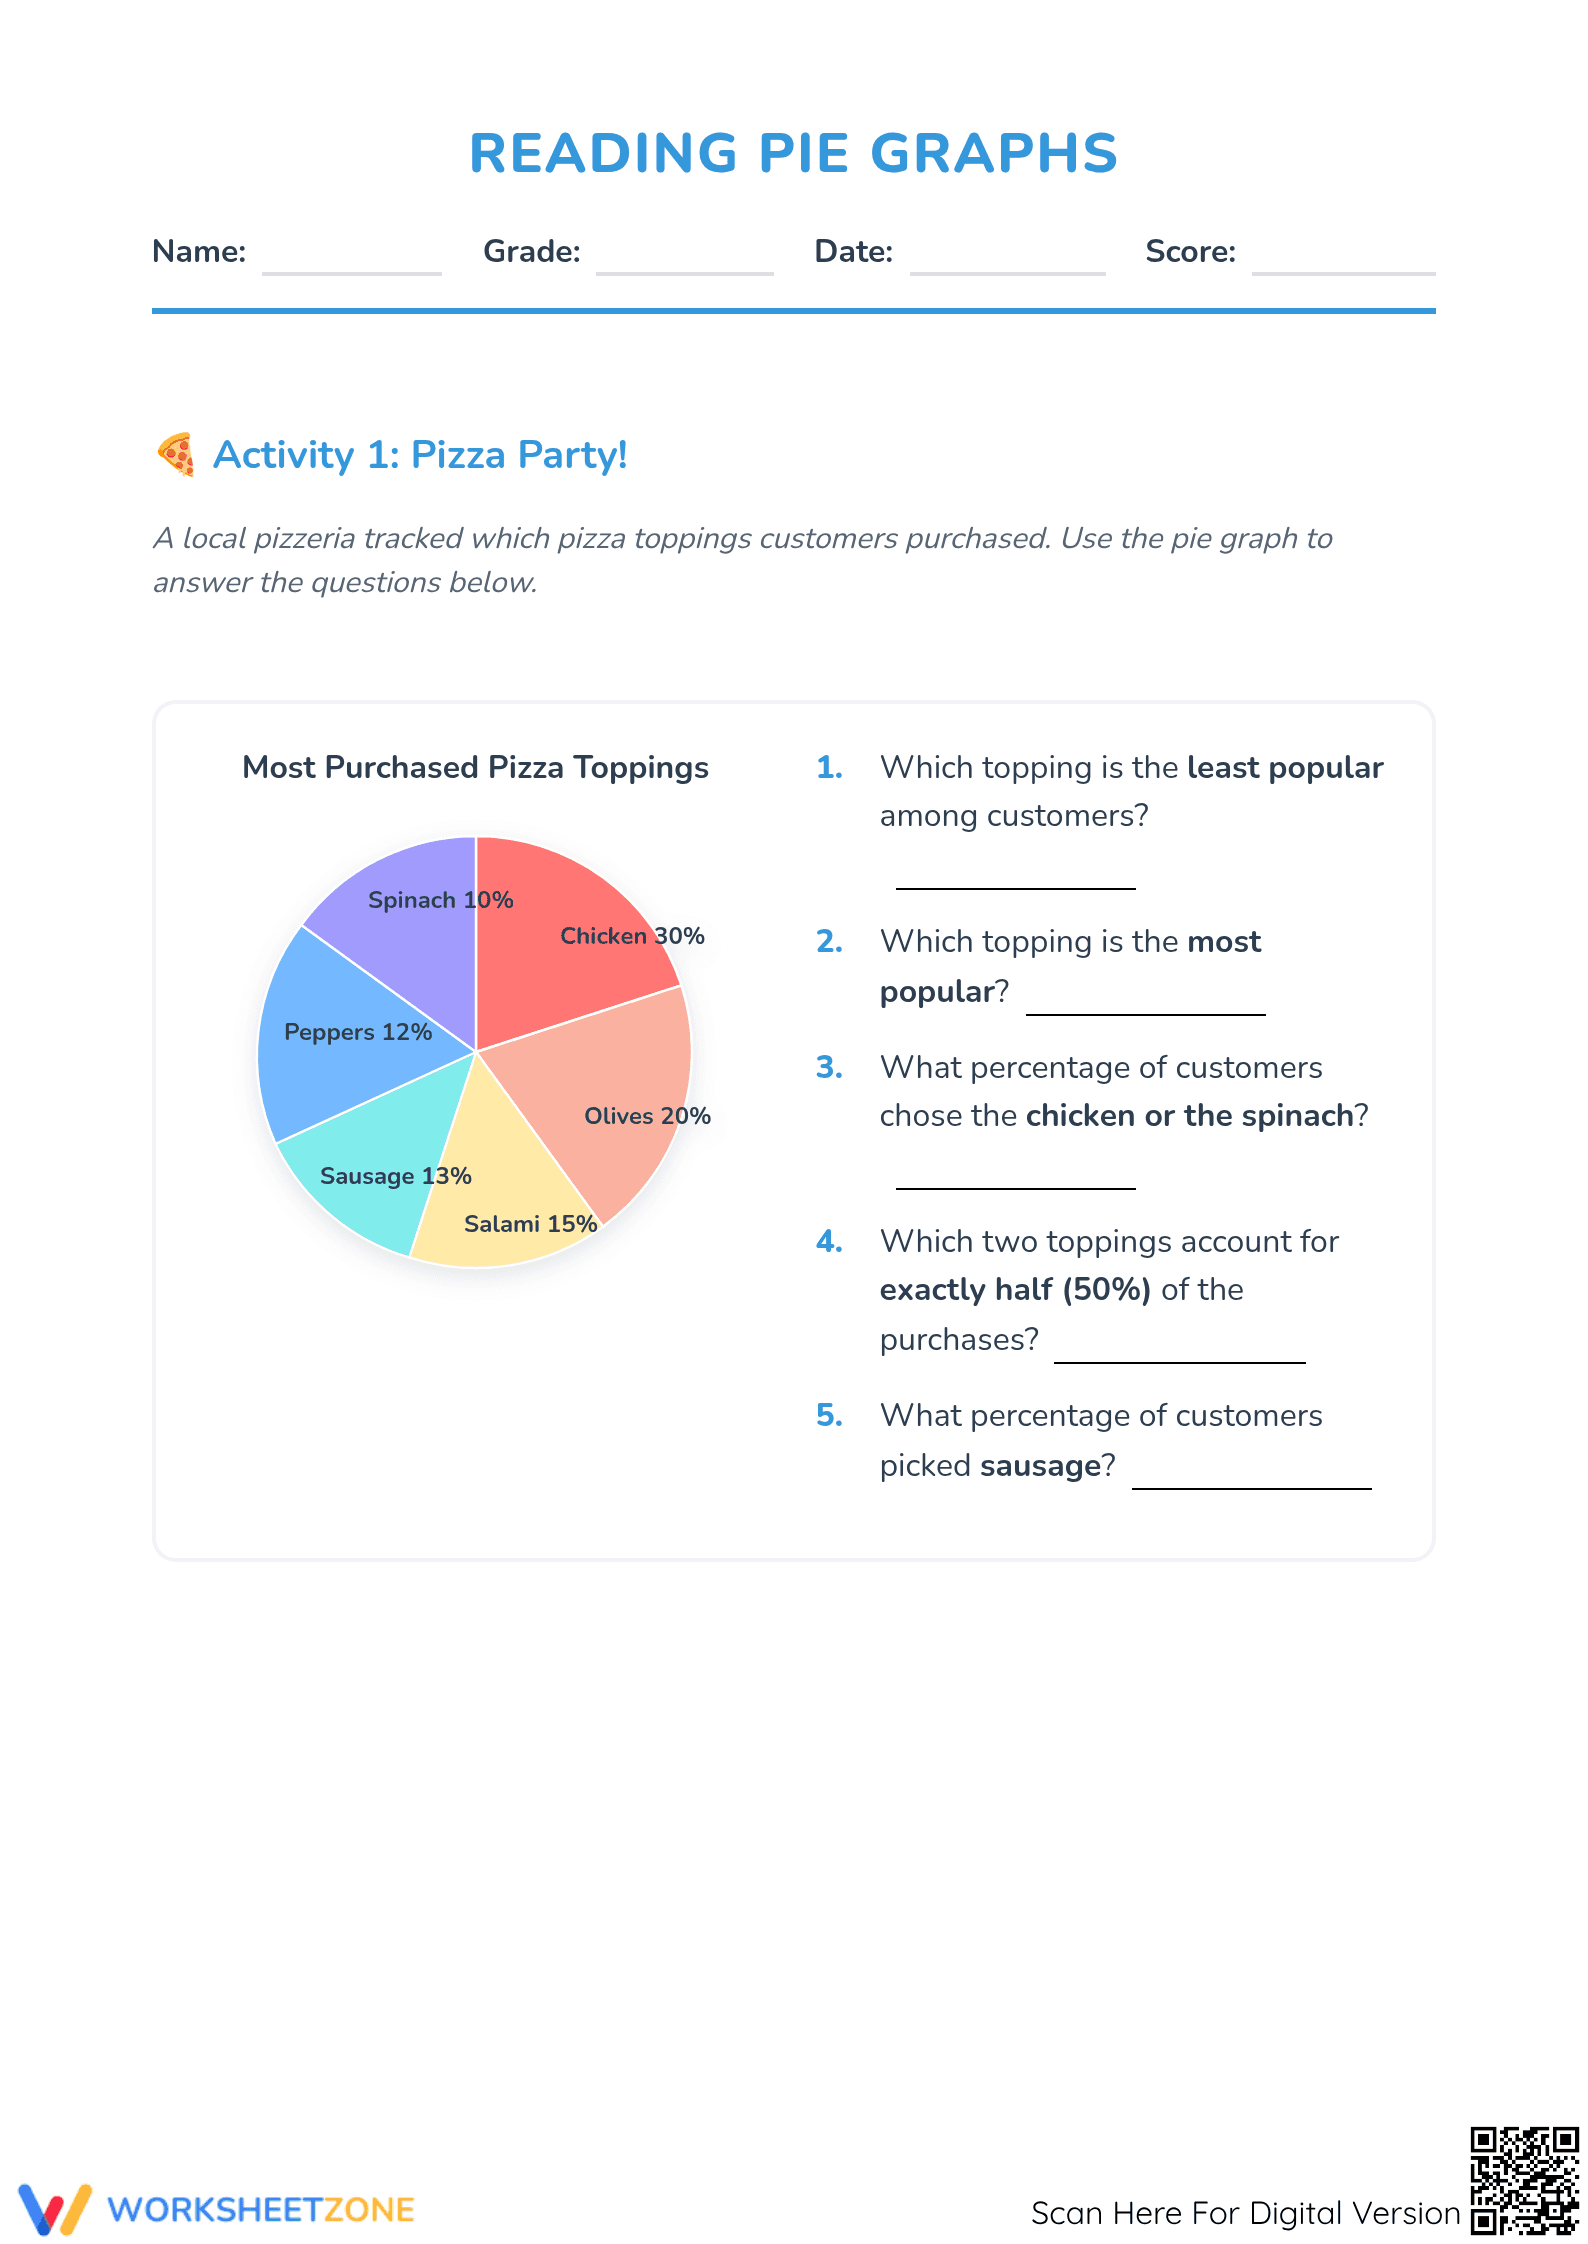
This Grade 4 circle graph worksheet empowers students to interpret visual data through real-world scenarios like pizza toppings and superhero preferences. By analyzing percentages within a circular layout, learners develop critical data literacy skills necessary for higher-level mathematics. Students move beyond simple identification to comparative analysis and basic calculation.
At a Glance
- Grade: 4 · Subject: Data
- Standard:
CCSS.MATH.CONTENT.4.MD.B.4— Interpret data sets to solve problems involving fractions and percentages.- Skill Focus: Circle Graph Interpretation
- Format: 2 pages · 13 problems · Answer key included · PDF
- Best For: Independent practice or formative assessment
- Time: 20–30 minutes
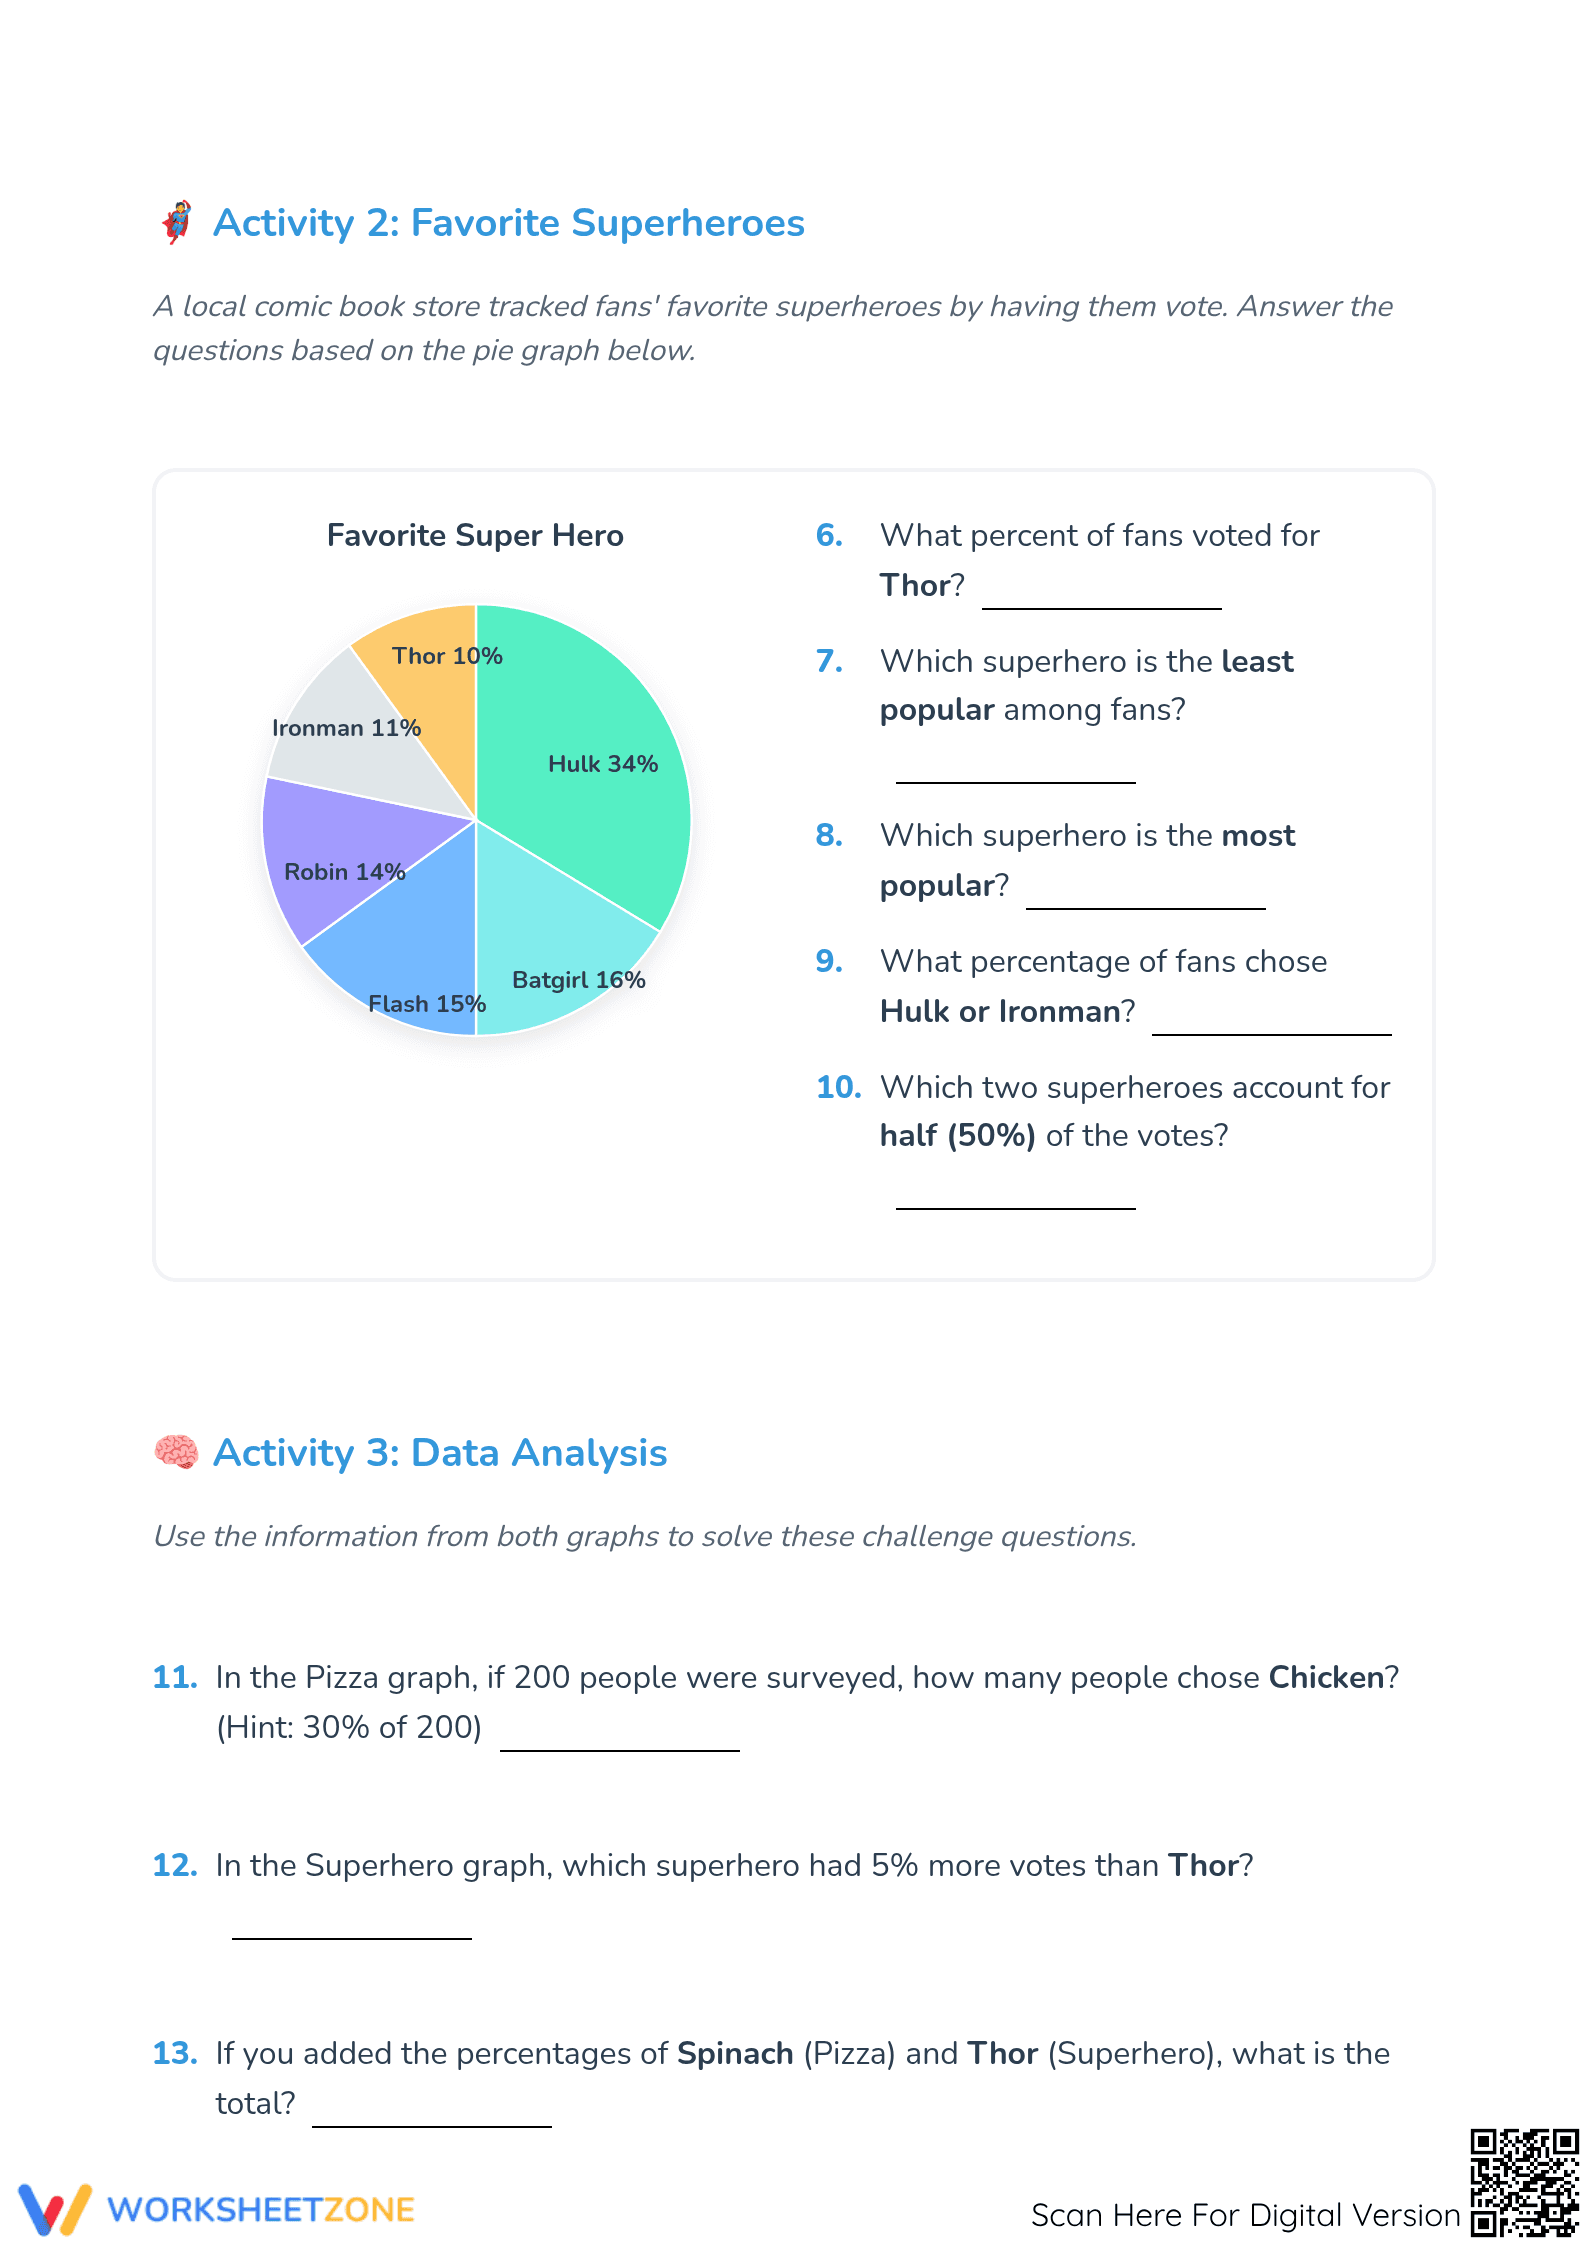
The resource contains two full pages of data analysis. Page one features a "Pizza Party" theme with 5 targeted questions, while page two explores "Favorite Superheroes" with 5 additional questions. A final "Data Analysis" section provides 3 challenge problems that require cross-graph comparison and percentage-to-quantity conversion. A comprehensive answer key is provided for quick grading and immediate student feedback.
This resource follows a zero-prep workflow designed for busy educators. First, print the two-page PDF (30 seconds). Second, distribute the sheets to students for independent or partner work (1 minute). Third, use the included answer key to review student responses or facilitate a whole-class check (5 minutes). Total teacher preparation time is under 2 minutes, making it an ideal choice for morning work or unexpected substitute teacher needs.
Primary alignment is `CCSS.MATH.CONTENT.4.MD.B.4`, which requires students to solve problems using information presented in line plots and other data displays. This worksheet extends that logic to circle graphs, a vital precursor to 6th-grade statistics. It specifically targets the ability to compare categories and combine percentages. Both standard codes can be copied directly into lesson plans, IEP goals, or district curriculum mapping tools.
Use this worksheet as a mid-unit check after introducing the concept of parts-of-a-whole. It works exceptionally well as a "Wednesday Workshop" activity or a reliable sub plan. During instruction, observe if students can identify the "least popular" and "most popular" categories visually before checking the numerical percentages to confirm their findings. This helps build spatial reasoning alongside numerical literacy.
This is designed for Grade 4 students but serves as an excellent challenge for Grade 3 or a review for Grade 5. It is ideal for visual learners who benefit from color-coded data representations. Pair this with a blank circle graph template to allow students to create their own class surveys, or use it as a bridge to lessons on converting percentages to decimals.
According to the RAND AIRS 2024 report, visual data literacy is a significant predictor of success in middle school STEM courses. This worksheet addresses that need by requiring students to translate abstract percentages into concrete comparisons. By engaging with 13 distinct tasks, students build the stamina required for standardized testing environments. The inclusion of multi-step "Challenge Questions" aligns with Fisher & Frey’s (2014) gradual release of responsibility model, moving students from simple retrieval to complex synthesis. Educators can utilize this resource to bridge the gap between basic arithmetic and statistical reasoning. The structured layout ensures that students remain focused on the data rather than being overwhelmed by complex text, making it a high-utility tool for diverse classrooms. This resource provides the structured practice necessary for students to achieve mastery in data interpretation.