These 3rd grade scaled pictographs printable worksheets give teachers a ready set of structured practice resources for one of the most conceptually demanding data topics in the elementary math sequence — the shift from simple one-to-one symbol representation to keyed, multiplicative representation. Each worksheet in the set addresses CCSS.MATH.CONTENT.3.MD.B.3, and because that standard requires students to both draw and interpret scaled picture graphs, the resources cover both directions: reading completed graphs and constructing new ones from raw data tables.
What Each Worksheet in the Set Covers
The skills spread across the set maps directly to how scaled pictograph instruction unfolds in the classroom — from reading the key before any counting begins, to applying that key value across every category row, to handling the conceptual leap of half-symbols. Each worksheet targets a specific piece of that progression rather than trying to hit everything at once.
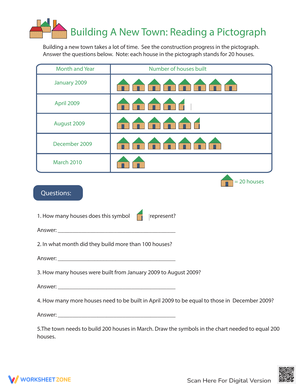
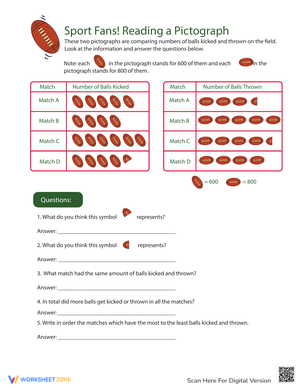
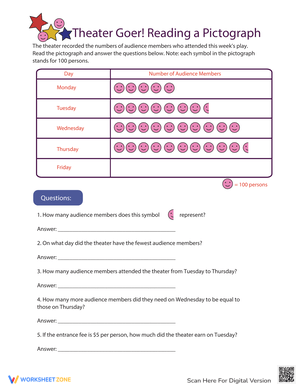
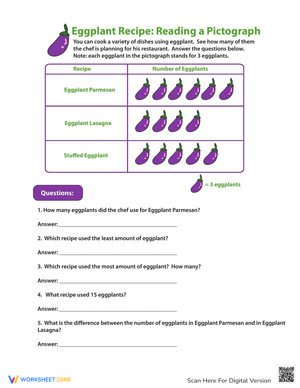
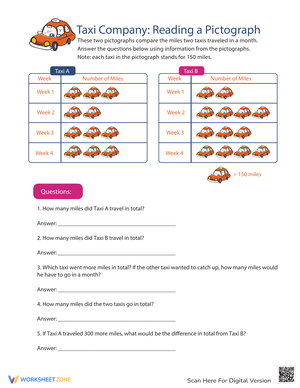
- Key interpretation: Students identify what each symbol represents and apply that value before answering any questions — a deliberate habit that needs to be built early.
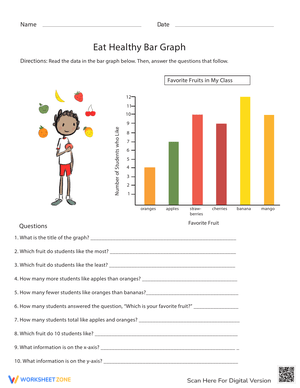
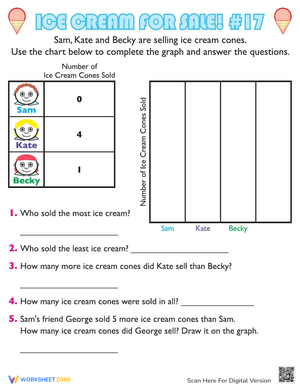
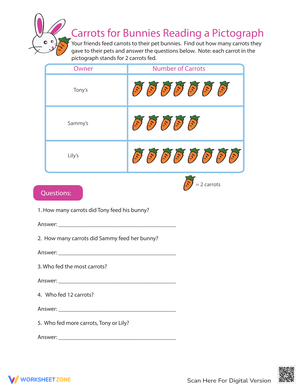
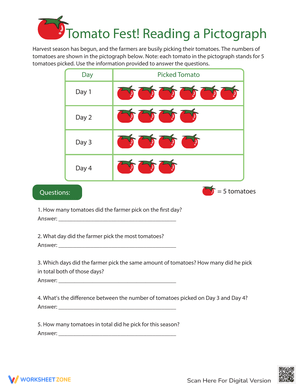
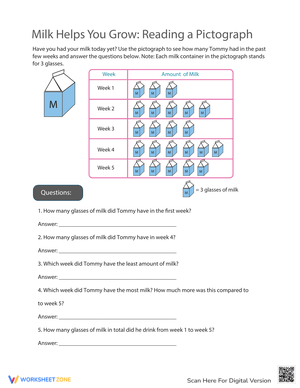
- Category totals: Students count symbols in a row, multiply by the key value, and record the result. This is where multiplication facts enter the data context for the first time.
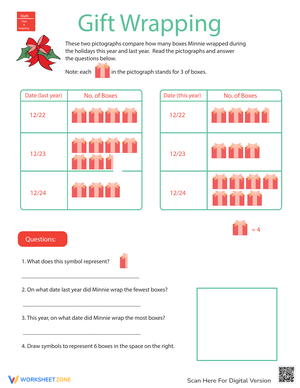
- Half-symbol recognition: Several worksheets include rows where the data requires a half-symbol. Students must calculate half the key value and add it to their running count — an early fraction application that surprises many third graders.
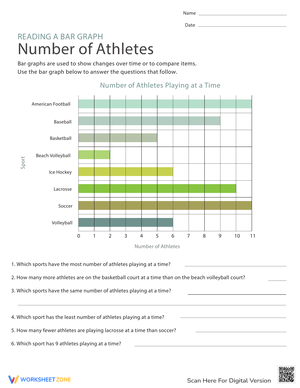
- Comparison questions: One-step problems ask how many more or fewer items appear in one category than another. Two-step problems add a layer: multiply, then subtract, which is where arithmetic fluency and data reasoning meet.
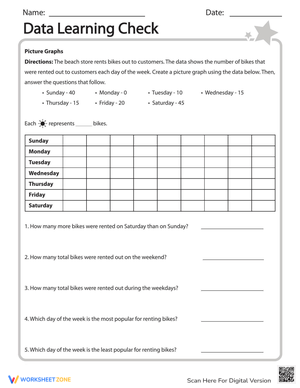
- Graph construction: Given a frequency table, students choose an appropriate key value and draw the correct number of symbols, including half-symbols where the data demands it.
- Word problem extensions: Some worksheets move beyond the graph itself — asking what the symbol count would look like if 15 more responses were added to one category, or which key value would work for a dataset where the highest total is 45.
Frequent Mistakes Worth Watching For
The most consistent error in student work with scaled pictographs is ignoring the key entirely. A student who counts six fish symbols writes "6" as the category total — not because they misread the problem, but because counting is automatic and multiplying by the key value is the new, effortful step. Having students circle the key before touching any questions is a simple procedural habit that catches this error, and it is worth enforcing from the very first worksheet the class sees.
Half-symbols produce a different kind of error. If the key reads "one circle equals 4 students" and a category shows three and a half circles, the two most common wrong answers are 12 (ignoring the half entirely) and 16 (treating the half-symbol as a full one). Both errors share the same root cause: students have not yet internalized that fractions and multiplication can appear together inside a data task. Cutting a paper symbol in half during class — literally, with scissors — does more to anchor the concept than re-explaining the rule does. Students remember the physical act.
Two-step comparison problems are where arithmetic fluency and data reasoning collide hardest. Students who read the graph correctly and find accurate category totals frequently lose precision when they then have to subtract two multiplied values. Writing the multiplication step on paper before attempting the subtraction reduces errors noticeably, and it makes the multi-step structure visible when you review work as a class.
Working These Worksheets Into Your Weekly Math Block
The most natural entry point for this set is a live class survey. Before handing out the first reading-and-interpreting worksheet, run a quick four-category survey — favorite school lunch works — and record results on the board. Then ask students which key value makes sense: if the highest category has 18 responses, a key of 2 produces 9 symbols per row, a key of 5 produces 3.5 symbols (awkward), and a key of 10 produces fewer than 2. That brief decision-making conversation gives students a real referent before they see the printed worksheet.
Within the week, the different worksheet types fit naturally into a three-station rotation: reading-and-interpreting at one station, data-table-to-graph construction at a second, and word problem extensions at a third. Students who finish early at the construction station can redraw their graph using a different key value to see how the number of symbols changes. That variation builds deeper understanding without requiring a new worksheet.
For the last 10 minutes of a period — the window before transitions or pickup — a single reading-and-interpreting worksheet functions as a low-stakes formative check. Scanning how students handled the comparison questions, specifically whether they showed the multiplication step before subtracting, gives a clear read on where the class stands before the next lesson. These 3rd grade scaled pictographs printable worksheets work just as well in that short closing slot as they do in a full station rotation, which makes lesson planning more flexible without sacrificing focus.
Standard Alignment
These worksheets address CCSS.MATH.CONTENT.3.MD.B.3, which sits within the Measurement and Data domain and requires Grade 3 students to draw scaled picture graphs and scaled bar graphs and to use those graphs to solve one- and two-step problems. The placement of this standard in Grade 3 is deliberate. Second graders work with data using simple, one-to-one graphs. Fourth grade moves into line plots and more complex representations. The Grade 3 window is when multiplication is still being formalized, and scaled pictographs give students a meaningful context to practice multiplication facts inside a task that looks like real data collection rather than a number drill. That connection makes the standard easier to justify to students who ask why it matters.
Adjusting the Worksheets for a Range of Learners
For students who are still building confidence with multiplication facts, start with worksheets that use a key of 2. The arithmetic stays manageable even for students who are not yet fluent through the fives, and the structure of reading the key, multiplying, and recording becomes automatic before key values increase. Once a student handles key-of-2 worksheets accurately, a key of 5 follows naturally because skip-counting by fives tends to be more automatic than other multiples at this grade level.
Students who move through reading-and-interpreting tasks quickly benefit most from the construction worksheets — particularly those where they must choose the key value themselves. That decision requires looking across the full range of data values, finding a key that produces whole or half-symbol counts for every category, and then executing the drawing accurately. The cognitive demand is significantly higher than reading a completed graph. For the most advanced students, the word problem extensions — especially the "what would change if..." questions — push into genuine mathematical reasoning about data rather than graph-reading fluency.
For students who struggle specifically with half-symbols, a brief visual reference showing "one full symbol equals 10; one half symbol equals 5" with a drawn example at the top of the worksheet helps more than a written explanation does. Students can glance back at it throughout the task without asking for help, which keeps the work moving and reduces frustration.
Frequently Asked Questions
What key values appear across the set?
The worksheets use key values of 2, 5, and 10. Keys of 2 appear in the introductory worksheets; keys of 5 and 10 appear in mid-unit and more advanced worksheets. Half-symbols appear across multiple key values since recognizing and calculating with half-symbols is part of the CCSS.MATH.CONTENT.3.MD.B.3 expectation, not a separate advanced skill.
Do the worksheets include answer keys?
Yes. Each worksheet comes with a corresponding answer key showing correct category totals, comparison answers, and — for construction tasks — the correct number of whole and half-symbols for each data row.
On the graph-construction worksheets, do students draw their own symbols?
Students draw their own symbols inside blank pictograph templates. Each worksheet includes a symbol guide in the key area so students know what shape to use. The focus is on placing the correct number of symbols — including half-symbols when needed — rather than on drawing quality, which keeps the task accessible regardless of fine motor skill level. These 3rd grade scaled pictographs printable worksheets are formatted with enough vertical space in each symbol row that drawing is manageable for most eight- and nine-year-olds without the rows feeling cramped.
Can these worksheets serve an assessment function, or are they practice-only?
The reading-and-interpreting worksheets work well as formative checks — they take 10 to 12 minutes to complete and the student work is quick to scan for the specific errors described above. For more formal summative use, the word problem extension worksheets require multi-step reasoning and give a clearer picture of overall mastery. Some teachers use a reading-and-interpreting worksheet at the unit's start as a pre-assessment and repeat a similar one at the end to document growth. The 3rd grade scaled pictographs printable worksheets in this set include enough variety across formats and key values that two administrations with the same class don't feel repetitive.


 BACK TOSCHOOL