These 3rd grade data and graphing printable worksheets resources give teachers structured practice for the exact point in the year when students stop just naming graph types and start actually interpreting them — reading a scale, using a key, and turning visual data into written answers. The set covers picture graphs, bar graphs, scaled graphs, line plots, and tally-to-graph tasks, with questions that range from basic value identification through two-step comparison problems. Each worksheet arrives focused on one format or skill, which keeps the cognitive load manageable and the lesson purpose clear.
The Specific Skills Each Worksheet Targets
Grade 3 is the first year students encounter scaled graphs — graphs where each interval represents more than one unit. That single shift is where many students struggle, and the set addresses it directly.
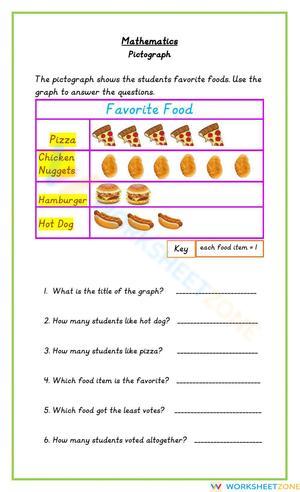
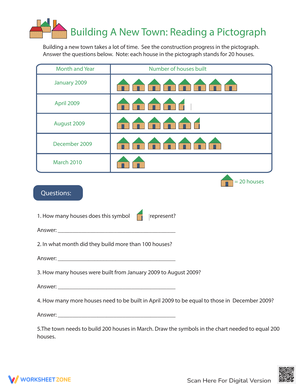
- Picture graphs with multi-unit keys: Students read a key where each symbol stands for 2, 4, or 5 items, then compare categories and find totals using multiplication or repeated addition.
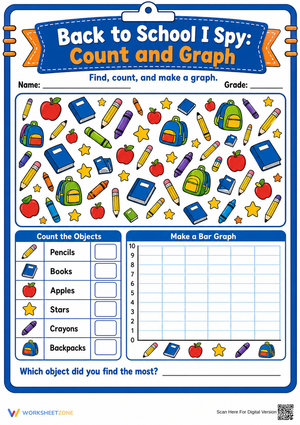
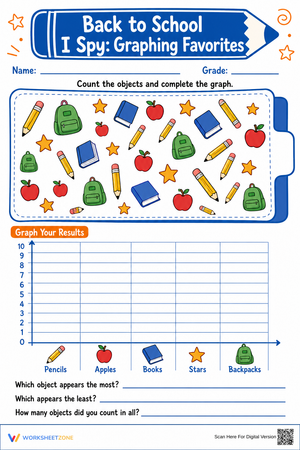
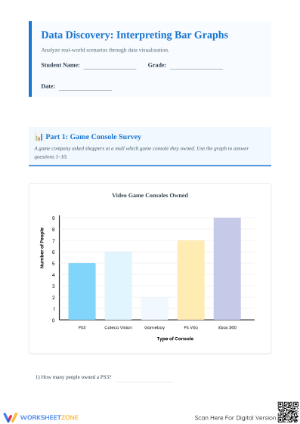
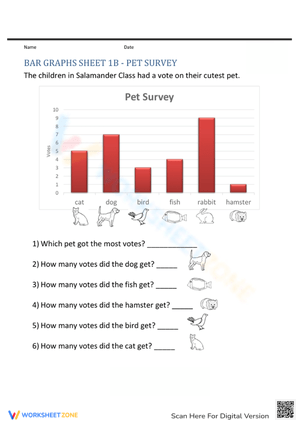
- Bar graphs: Students identify bar values, write comparison sentences using phrases like "how many more" and "how many fewer," and solve one-step problems from the data.
- Scaled bar graphs: Students interpret an interval scale — typically counting by 2s, 5s, or 10s — and answer questions that cannot be solved by simply reading a label.
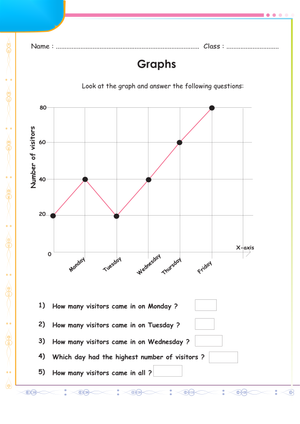
- Line plots: Students read frequency marks along a number line, find totals, identify the most and least common values, and compare groups.
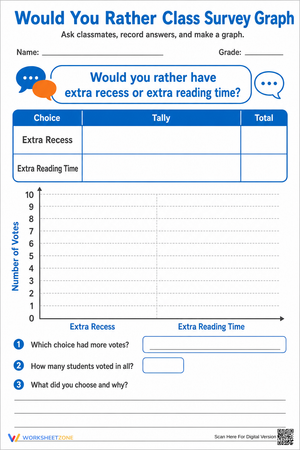
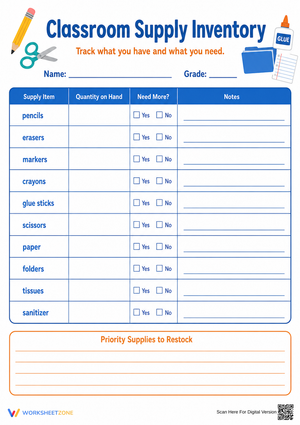
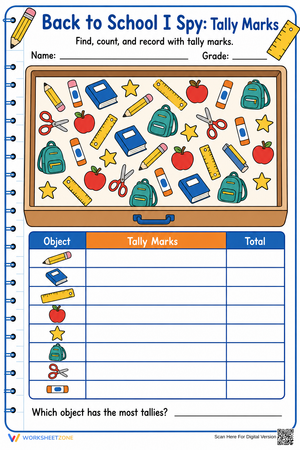
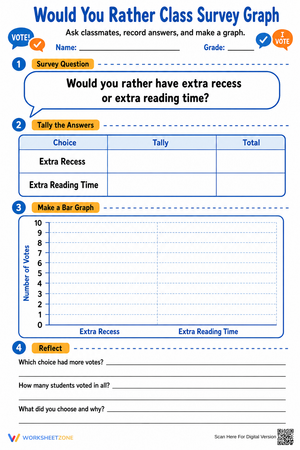
- Tally charts and survey data: Students organize raw counts into a tally chart or transfer tally data into a graph before answering analysis questions.
- Two-step word problems from data: Students combine two pieces of graph information to solve a single question — for example, finding the combined total of two categories and then comparing it to a third.
When you look across 3rd grade data and graphing printable worksheets collections from sites like K5 Learning and Education.com, the strongest resources pair visual data with written questions that require students to explain or calculate — not just circle an answer. That question variety is what makes the difference between practice that checks recognition and practice that builds interpretation.
Student Error Patterns Worth Knowing Before You Assign These
The most consistent error in scaled graph work happens when students read a bar's height as its exact value. On a bar graph scaled by 5s, a bar that reaches the fourth gridline represents 20 — but students new to scaled graphs will write 4. They are counting intervals rather than multiplying by the scale value. This error shows up in virtually every class the first time scaled graphs are introduced, and it is worth addressing before students work independently rather than after you collect their worksheets.
Pictograph errors tend to cluster around the key. A student who understands that each smiley face equals 4 will still count individual symbols one-to-one if the question asks for a total — the counting habit at this age is strong. A half-symbol, which some pictographs include, creates additional confusion unless teachers build that into pre-teaching. Line plot errors look different: students usually read the individual marks correctly but then subtract the wrong values on comparison questions, mixing up "how many more students chose X than Y" with "how many chose X in total." Watching for which error pattern appears in your class tells you where the next lesson needs to go.
Smart Ways to Fit These Worksheets Into the Math Block
The most efficient use of a graphing worksheet is often not end-of-lesson practice — it is the warm-up that activates prior knowledge before a new concept. A standard bar graph worksheet placed at the start of a scaled graph lesson gives students a low-pressure reference point. They are confident with standard bars, which makes the interval shift feel less like unknown territory. That sequence — familiar format first, new challenge second — is a direct application of gradual release without requiring extra materials.
For math centers, choose worksheets that each focus on one graph type. Mixed-format review worksheets work better in whole-group settings or as pre-assessment tools, where you can watch how students navigate the shift between formats. Exit checks work especially well with line plot worksheets: pull four questions from a single worksheet, have students complete them in the last eight minutes of math time, and you have usable data before the next lesson starts. For intervention groups, the tally-chart worksheets earn their place because they let you see whether a student's confusion is with the graph itself or with organizing data beforehand — those are different problems requiring different responses.
One genuinely practical tip: keep a data and graphing worksheet in your substitute folder. These tasks tend to run smoothly with subs because the directions are visual, the task is contained, and students can work through meaningful math practice with minimal front-of-room explanation. Among all the 3rd grade data and graphing printable worksheets formats, bar graph worksheets tend to hold up best in this situation because the visual is self-explanatory and the questions are direct.
Standard Alignment
These worksheets align to CCSS.MATH.CONTENT.3.MD.B.3 — drawing scaled picture graphs and bar graphs to represent data sets with several categories, and solving one-step and two-step comparison problems — and to CCSS.MATH.CONTENT.3.MD.B.4, which covers generating measurement data and representing it on line plots. In classroom terms, the MD.B.3 standard usually lands in the second half of the year, after students have spent time with multiplication and skip-counting, because scaled graphs depend on that thinking. MD.B.4 connects naturally to measurement units and often pairs well with ruler and length work from earlier in the grade. Placing the line plot worksheets inside your measurement unit rather than saving them for a standalone data unit gives students a context that makes the format feel purposeful rather than abstract.
Adjusting the Set for Different Learner Levels
The format of 3rd grade data and graphing printable worksheets resources adapts well to tiered instruction because the graph is visual and the question difficulty can shift independently of the image itself. You can show every student the same bar graph and distribute different question sets — one group answers "which category has the most?" while another group solves "how many more items would Category B need to equal Category A?"
For students who need more support, use worksheets where the scale is 1 — standard bar graphs with no interval multiplication required — and limit questions to direct reads rather than comparisons. A brief vocabulary review of words like key, scale, category, and difference before students begin removes a layer of confusion that has nothing to do with their math ability. For students working above grade level, assign scaled graph worksheets where the interval is not a round number, or ask them to construct their own graph from a provided tally chart and then write two comparison questions a classmate could answer using what they made. That task moves them from consumer to producer of data — a genuine extension that does not require a separate resource or a different worksheet entirely.
Frequently Asked Questions
What graph types do Grade 3 students need to practice?
The core formats at this grade level are picture graphs with multi-unit keys, bar graphs, scaled bar graphs, and line plots. Tally charts are a useful entry point because they connect data collection to display before students move into graph construction. The format that appears most often on state assessments is the scaled bar graph, so students benefit from repeated exposure to reading intervals before the unit ends.
Can I use these worksheets for both new instruction and review?
Yes. Single-format worksheets — one bar graph, one focused question set — work well during initial instruction as the independent practice step after modeling. Mixed-format worksheets that move between a bar graph and a line plot are better suited to review, spiral practice, or pre-assessment, where the goal is to see how students handle shifting between representations. The two uses call for different worksheets from the set, not the same one used twice.
How do I handle scaled graph worksheets with students who keep misreading the scale?
Before assigning a scaled graph worksheet independently, do at least one guided example together and write the actual value next to each gridline so students see the number explicitly rather than inferring it. Then, when students move to independent work, encourage them to label the gridlines themselves before answering any questions. That small annotation step removes most scale-reading errors before they happen, rather than surfacing them after the fact in student answers.
Are these worksheets appropriate for use as a formative assessment?
A focused graphing worksheet — one graph type with four to six varied questions — gives you usable evidence of whether a student can read data accurately and apply it to a problem. For a summative unit grade, you would typically want something longer that samples multiple graph formats, but each worksheet in this set works well as a formative check or progress monitor. The exit-ticket use described above is the most efficient version: a few targeted questions, collected quickly, reviewed the same afternoon.