These histograms worksheets pdf for 6th grade give teachers a ready-to-print set of tasks that move students through three distinct skills: reading a finished histogram, building one from a frequency table or raw data list, and putting the distribution into words. The resources keep intervals consistent and contexts familiar—quiz scores, walking times, temperature readings—so students spend their attention on the statistics, not on decoding the setup.
What These Worksheets Ask Students to Practice
At this grade, the goal is building fluency with grouped numerical data before students encounter more complex statistical displays in 7th and 8th grade. Each worksheet stays anchored to the same core moves, and the sequence matters: students who read histograms well first tend to build them more accurately later.
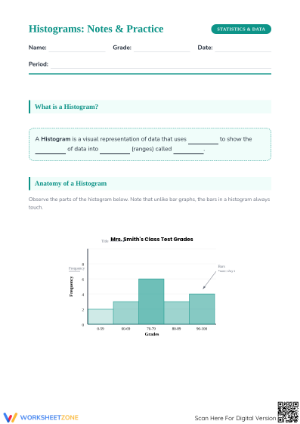
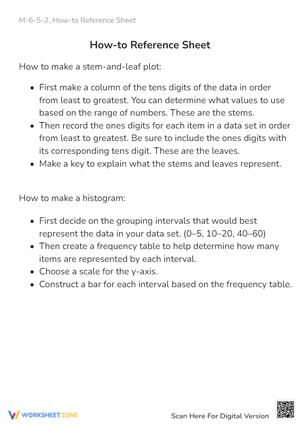
- Identify the title, axis labels, interval boundaries, and frequency scale on a completed histogram
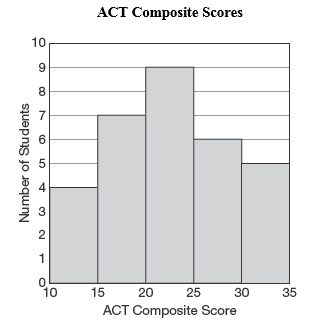
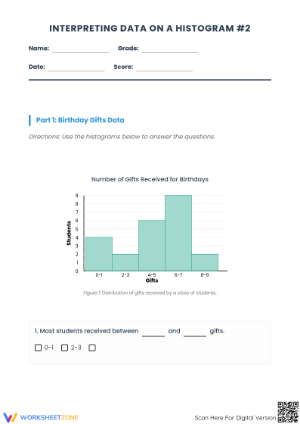
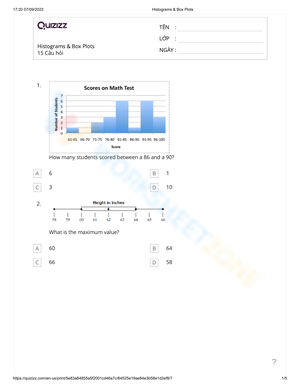
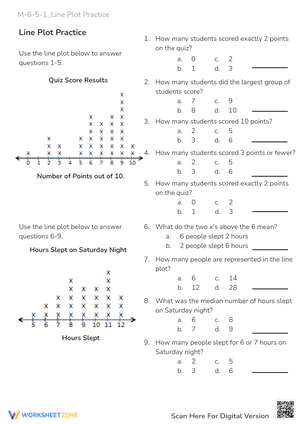
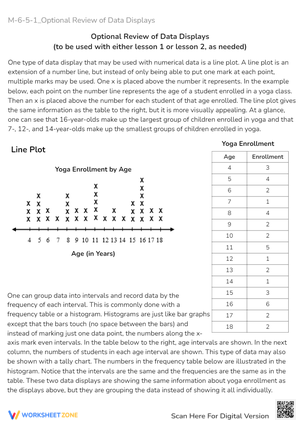
- Read how many data values fall within a specific interval, including cases where a bar's top lands between gridlines
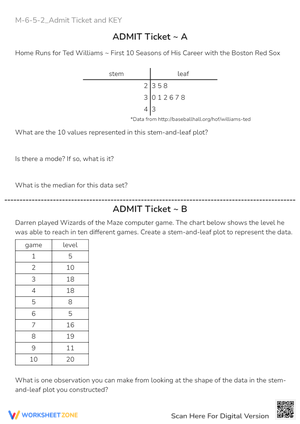
- Rank intervals by frequency and describe which holds the most or fewest values
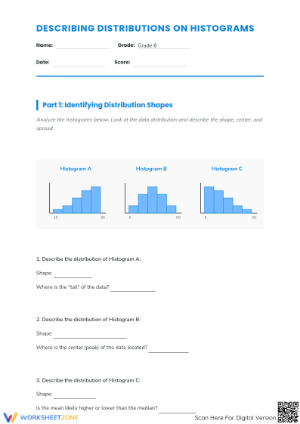
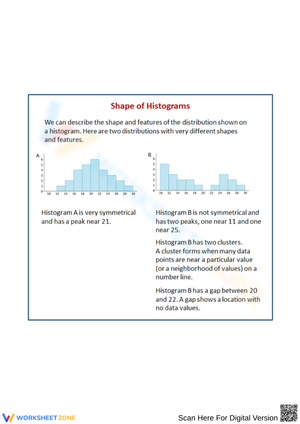
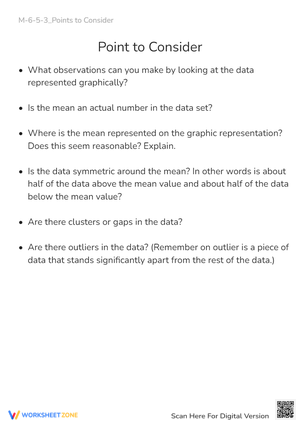
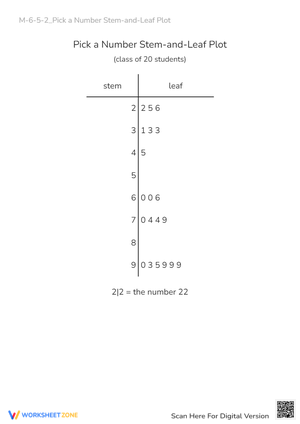
- Spot peaks, gaps, and clusters in a distribution and explain what they suggest about the data in context
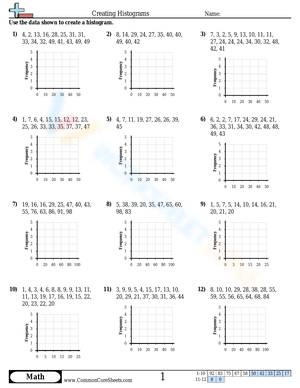
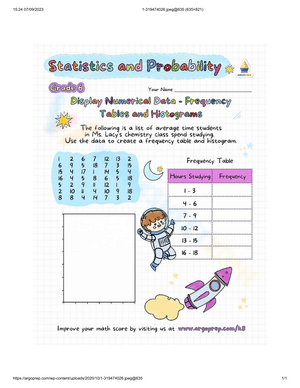
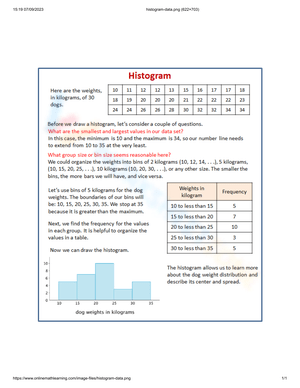
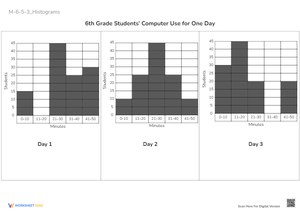
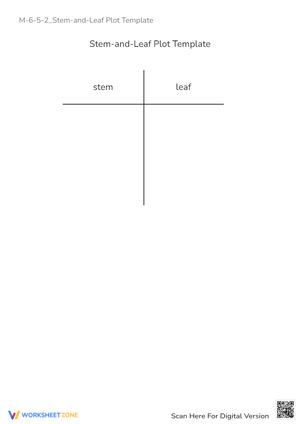
- Transfer a frequency table into a correctly drawn histogram with equal-width bins and touching bars
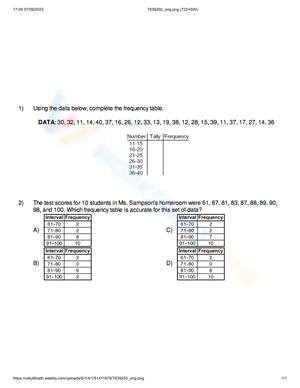
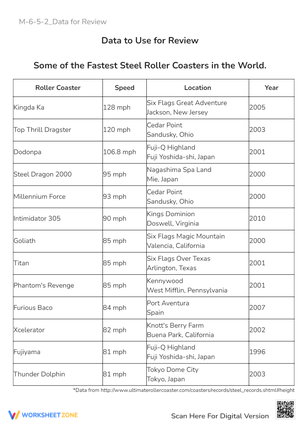
- Sort a small raw data set into intervals using a tally chart before placing any bars on the grid
That last item matters more than it might seem. Students who skip the tally step and jump directly to drawing bars nearly always make sorting errors—values end up in the wrong interval, and the mistake is almost invisible until the finished graph looks odd. Building the tally step into the worksheet before the graph grid appears makes those errors visible and fixable before they compound.
Student Errors Worth Anticipating Before You Teach This
The most durable confusion is treating a histogram like a bar graph. When students draw gaps between bars, it usually signals they're thinking of each bar as a distinct category—"these 7 students scored a 70"—rather than a continuous range of values. Simply telling students that the bars must touch doesn't fix this. What fixes it is making sure they understand why: a score of 70 and a score of 74 both belong to the same 70–79 interval, and that interval has no break in it. The touching bars represent that continuity, not a stylistic choice.
Unequal bin widths are a quieter problem. Students may write intervals like 0–4, 5–14, 15–20 without recognizing that the middle bin spans ten values while the others span only five. These worksheets reinforce equal-width intervals by giving students grids with pre-spaced horizontal axis marks, which makes uneven bins visually obvious before the graph is finished. Students can see the problem rather than just be told about it.
Scale misreading on the vertical axis shows up consistently when the count goes by 2s or 5s. A student whose bar lands halfway between 10 and 15 will confidently write 12 as the frequency without questioning it. A task sequence that starts with a scale of 1 or 2 and then introduces a scale of 5 or 10 gives students time to build reading accuracy before the intervals become less obvious.
Building These Worksheets Into a Week of Data Instruction
The most effective entry point is a brief whole-class launch using actual class data—homework minutes, number of library books read, steps counted during PE. After sorting values into equal intervals on the board together and talking through where the intervals come from, students move directly into a reading task that mirrors that same structure. The shared experience lowers the barrier significantly for students who are new to statistical displays.
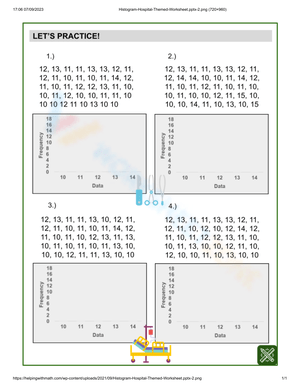
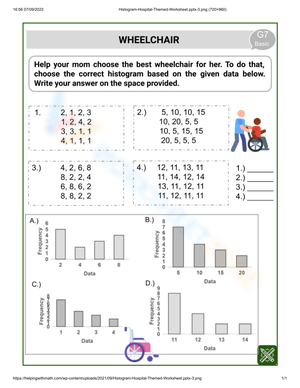
A three-part progression works well across roughly three days. Start with a read-and-interpret worksheet where the histogram is fully drawn and students answer questions about it. Move to a matching task where students connect a frequency table to the correct histogram from a set of three options—this is where you can observe whether students understand what each bar represents or are just pattern-matching by shape. Finish with a build-from-data worksheet where students sort raw data into a tally chart and then construct a labeled histogram from scratch. Histograms worksheets pdf for 6th grade that follow this arc give you a natural formative assessment trail across the week without requiring additional prep between tasks.
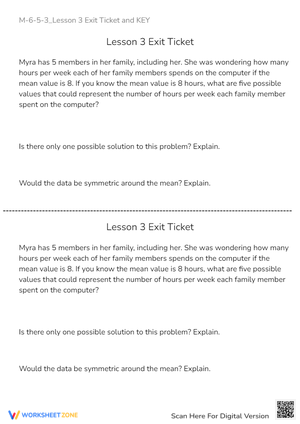
For exit tickets, one histogram with two questions—which interval has the highest frequency, and what does the distribution suggest about the data—takes about five minutes and gives a clear picture of what students can and cannot do independently. Stations work well too: vocabulary review at one station, graph reading at another, and data-to-histogram construction at a third.
Standard Alignment
These worksheets address CCSS.MATH.CONTENT.6.SP.B.4, which requires students to display numerical data in plots on a number line—including dot plots, histograms, and box plots—and to describe overall patterns and any striking deviations in context. In classroom terms, this standard falls in the second half of a 6th grade statistics unit, after students have worked with statistical questions and measures of center and spread. Histograms appear after dot plots in the sequence for a specific reason: students already understand how individual values sit on a number line, and histograms ask them to group those values into intervals and represent the grouped counts. That conceptual move from individual data points to grouped frequencies is exactly what 6th graders are developmentally ready to make—and what gives the standard its placement here rather than in 5th or 7th grade.
Adjusting the Worksheets Across Readiness Levels
For students who need additional support, the most effective adjustment is to reduce the number of moving parts. Use data sets with 10 to 15 values, provide the intervals already marked on the horizontal axis, and keep the vertical scale counting by ones or twos. Pairing the histogram task with a number line showing the same individual data points helps students see how those points become grouped frequencies. Structured prompts—"which interval contains the most values?" or "how many data points fall between 20 and 29?"—give students a clear starting point before asking them to generate their own observations.
For students ready to move further, the meaningful extension isn't a longer data set—it's a harder question. Ask them to choose their own interval width and justify that choice in writing. Present two histograms showing different data sets and ask which displays more spread and why. Or give them a data set that could be organized with 5-unit intervals or 10-unit intervals and ask which grouping produces a more useful picture of the distribution. These tasks push students to reason about the structure of the display, not just fill it in. Histograms worksheets pdf for 6th grade that include both a guided version and a more open-ended version of the same task let teachers assign different entry points within the same lesson without managing entirely separate materials.
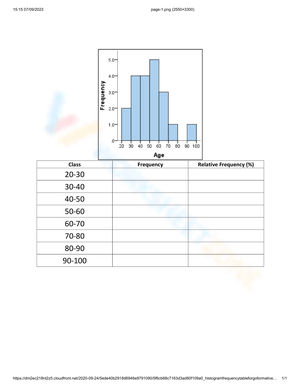
In intervention settings, pairing a histogram task with a completed frequency table—so students can verify their bar heights against a known count—makes it easier to isolate where the misunderstanding lives: in the counting stage or in the graphing stage. That distinction matters for how you follow up the next day.
Frequently Asked Questions
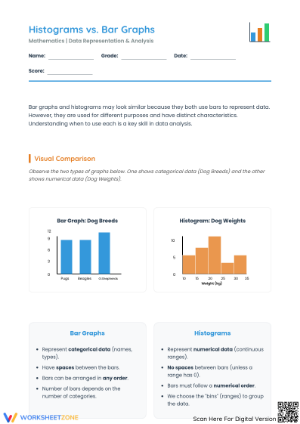
How is a histogram different from a bar graph?
In a histogram, bars touch because the data are continuous—each bar covers a range of numerical values, not a distinct category. In a bar graph, bars are separated because the categories don't overlap or share boundary values. Sixth graders who can articulate this difference in their own words, rather than just draw it correctly on command, have understood the underlying concept. Worksheets that ask students to write one sentence explaining the difference tend to surface gaps that a drawing task alone won't catch.
What interval widths work well for 6th grade practice?
Equal-width intervals with clean boundaries—0–9, 10–19, 20–29, or 0–4, 5–9, 10–14—keep the focus on reading and interpreting grouped data rather than on boundary arithmetic. For early practice especially, intervals that start at zero and increase by 5 or 10 reduce the cognitive load of decoding the scale while students are still building familiarity with the display. Student-chosen intervals belong in extension tasks, not in introductory ones.
Can these worksheets work for homework or as a sub plan?
Yes. Because each worksheet presents a self-contained task with a clear context and fully labeled axes, students can work through them independently without additional teacher setup. For any build-from-data worksheet used outside of class, filling in the first interval of the tally chart gives most students enough of a foothold to continue on their own.
Do these cover what appears on standardized assessments?
Both reading and building histograms appear on state assessments at the 6th grade level, and histograms worksheets pdf for 6th grade that address both directions—interpreting a finished graph and constructing one from raw data—give students practice with the question formats they're most likely to encounter. Interpretation questions in particular show up in short-answer format and require students to make a claim about what the data shows, not just report a single frequency value.