


1 / 5
0
Views
0
Downloads
0.0
0
Save
0 Likes
Bar & Double Bar Graph Worksheet: Favorite Cities Data Analysis
0 Views
0 Downloads
Paste this activity's link or code into your existing LMS (Google Classroom, Canvas, Teams, Schoology, Moodle, etc.).
Students can open and work on the activity right away, with no student login required.
You'll still be able to track student progress and results from your teacher account.
Information
Description
What It Is:
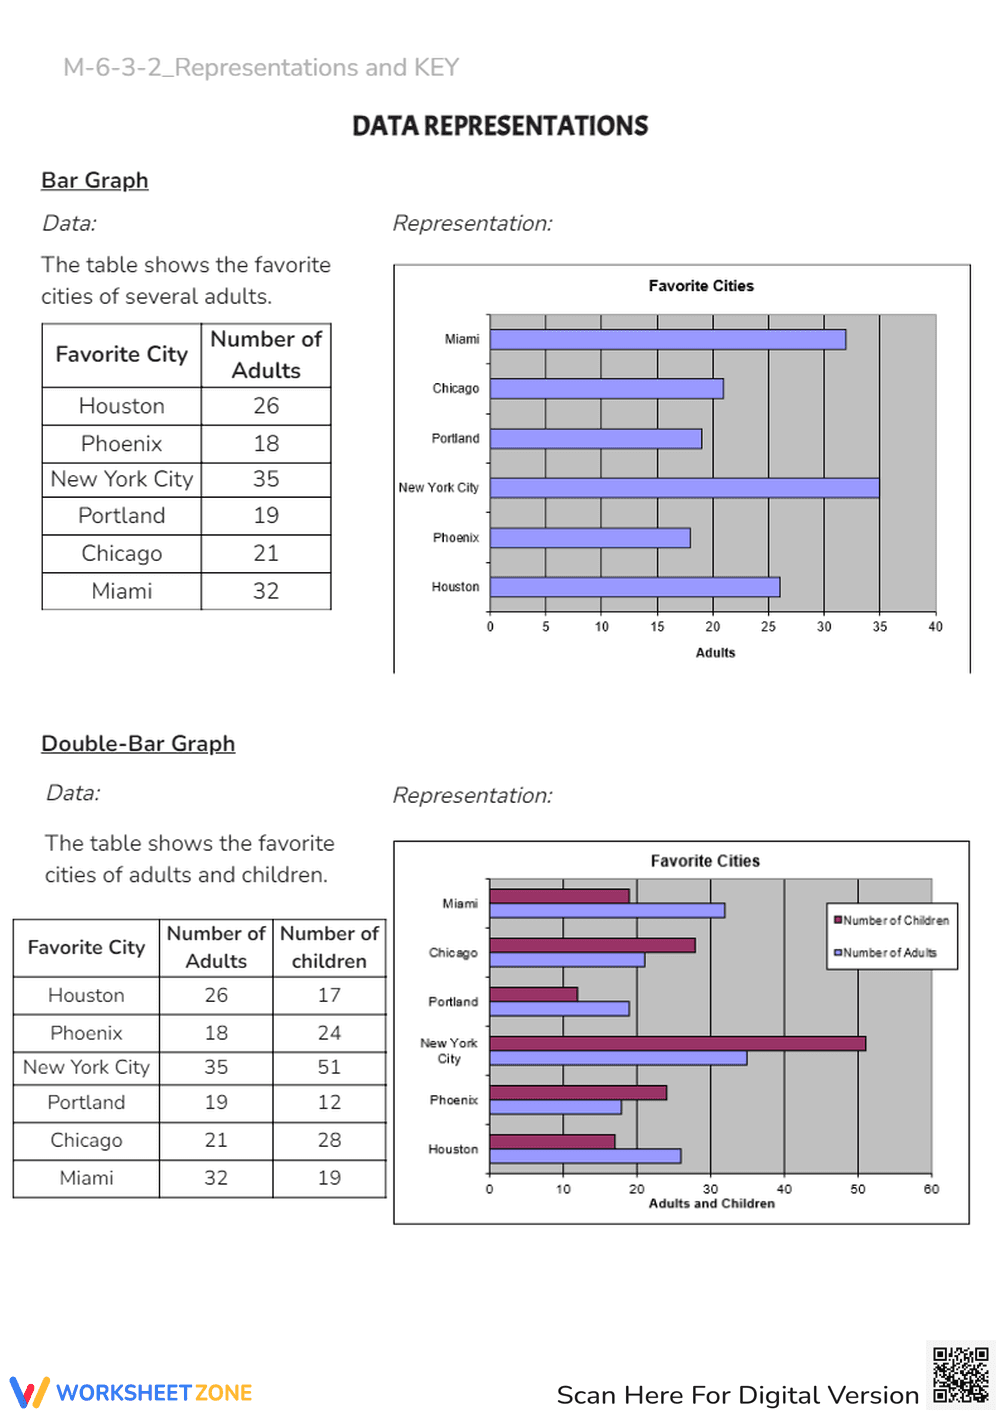
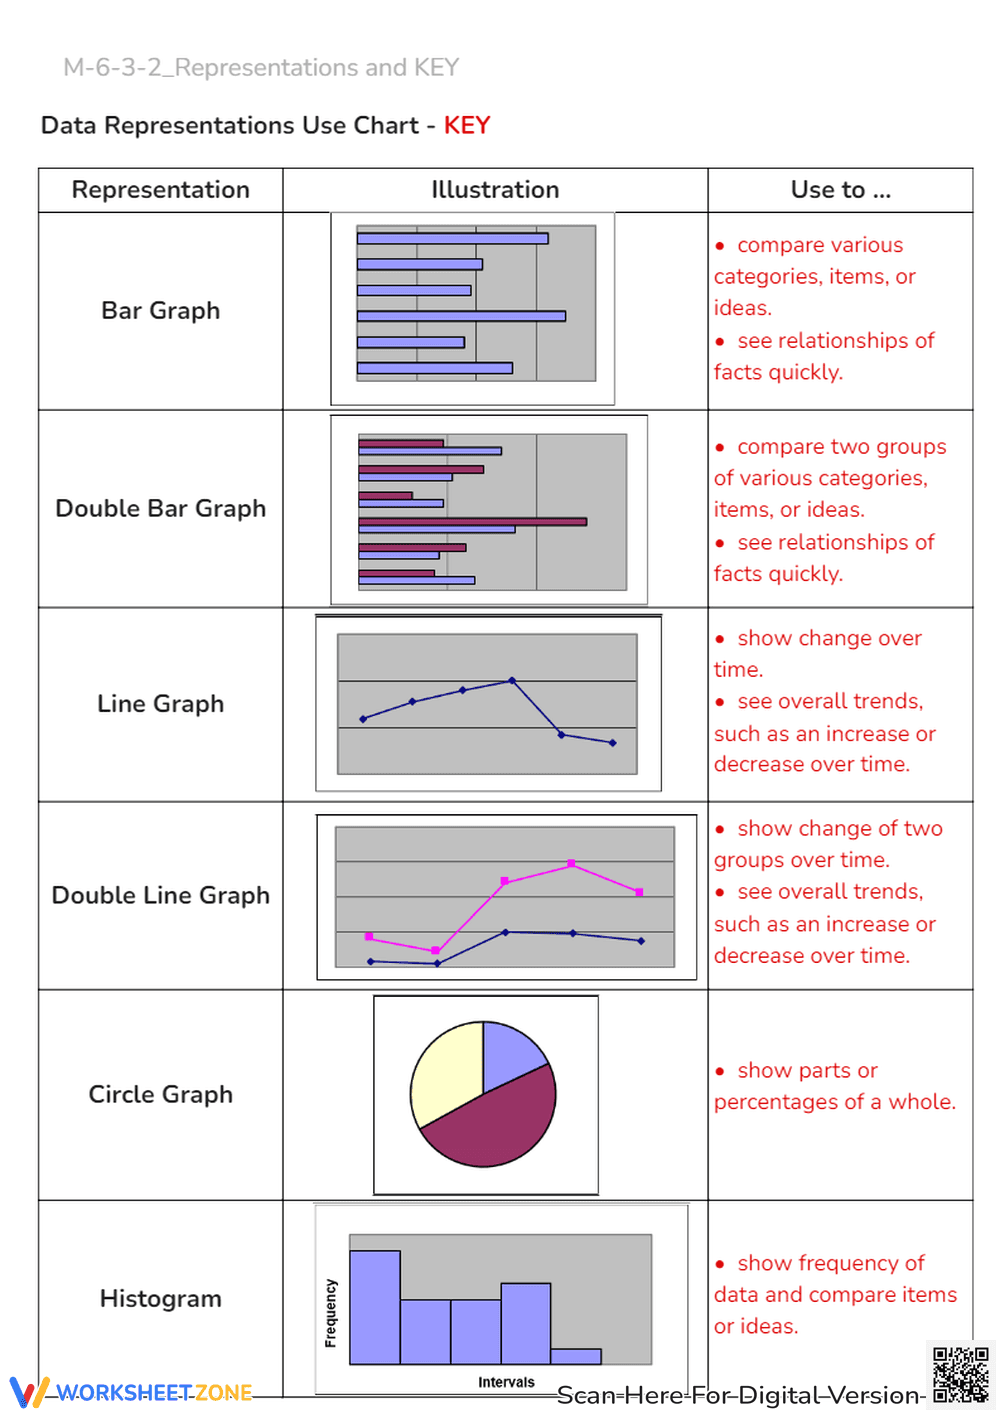
This is a worksheet about data representations, specifically bar graphs and double-bar graphs. The worksheet presents data in a table format, showing the number of adults (and children in the second example) who favor different cities. Students are expected to interpret the data and visually represent it in the provided bar graph and double-bar graph templates.
Grade Level Suitability:
This worksheet is suitable for grades 4-6. The concepts of bar graphs and double-bar graphs are typically introduced and reinforced during these grade levels. The data presented is relatively simple, making it accessible to students in this age range.
Why Use It:
This worksheet helps students develop skills in data interpretation and representation. It reinforces the ability to read and understand tables, and then translate that information into a visual format using bar graphs. It also introduces the concept of double-bar graphs for comparing two sets of data.
How to Use It:
Students should first read the data provided in the table. Then, using the provided bar graph or double-bar graph template, they should create bars that accurately represent the numbers for each city. For the double-bar graph, students will need to create two bars for each city, representing the number of adults and the number of children.
Target Users:
This worksheet is targeted towards elementary and middle school students learning about data representation and graphing. It is also useful for teachers looking for practice activities for their students on bar graphs and double-bar graphs.