


Views
Downloads
Histogram Notes & Practice Worksheet | Grade 6 Essential
Paste this activity's link or code into your existing LMS (Google Classroom, Canvas, Teams, Schoology, Moodle, etc.).
Students can open and work on the activity right away, with no student login required.
You'll still be able to track student progress and results from your teacher account.
Comprehensive Data Visualization
This comprehensive histogram worksheet guides students through the fundamentals of data representation. Students transition from conceptual notes to practical application by analyzing existing graphs and constructing their own. By mastering these skills, learners develop a critical eye for frequency distribution in real-world contexts.
At a Glance
- Grade: 6 · Subject: Math
- Standard:
6.SP.B.4— Display numerical data in plots on a number line, including histograms- Skill Focus: Data visualization and frequency distribution
- Format: 3 pages · 6 tasks · Answer key included · PDF
- Best For: Initial instruction and guided skill practice
- Time: 30–45 minutes
Detailed Resource Breakdown
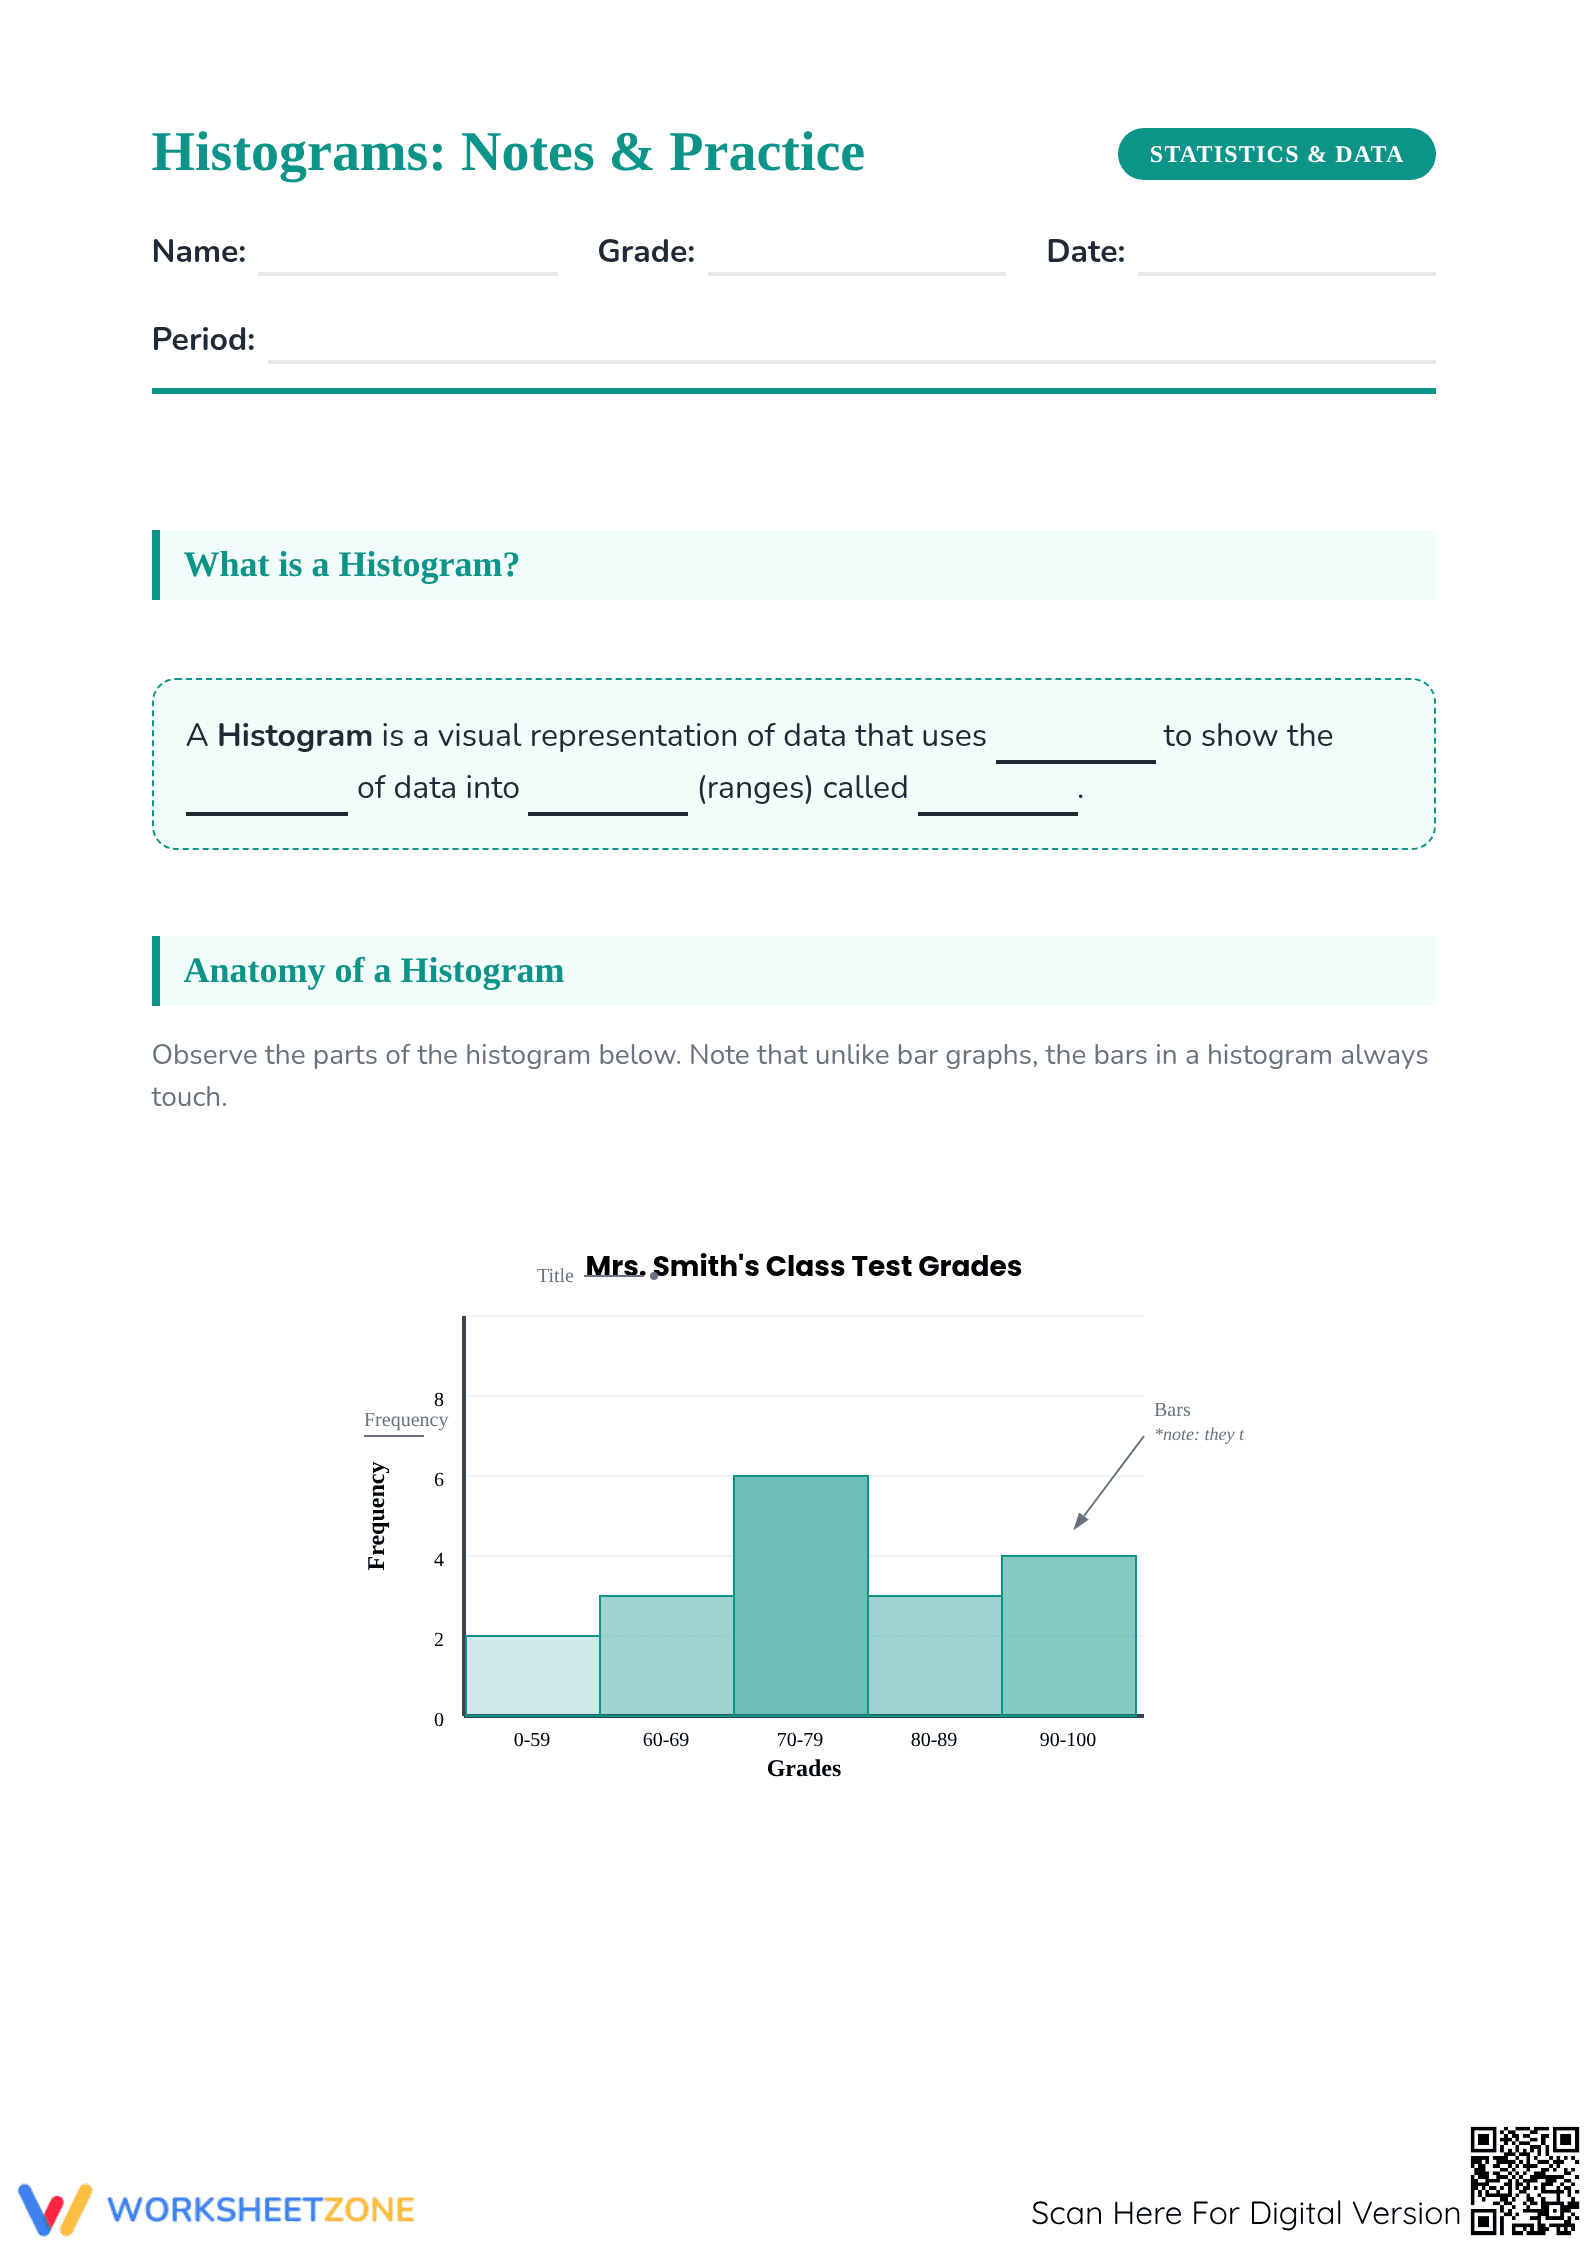
This three-page resource includes a structured "Anatomy of a Histogram" guide that clarifies the distinction between bar graphs and histograms. The package features four comprehension questions based on a sample dataset of class test grades. Students then practice data organization by completing a frequency table and plotting a new histogram based on a homework-time dataset.
Skill Progression Strategy
- Guided Practice: Students complete cloze-style notes and label a sample histogram to internalize vocabulary like "frequency" and "intervals" with immediate visual support.
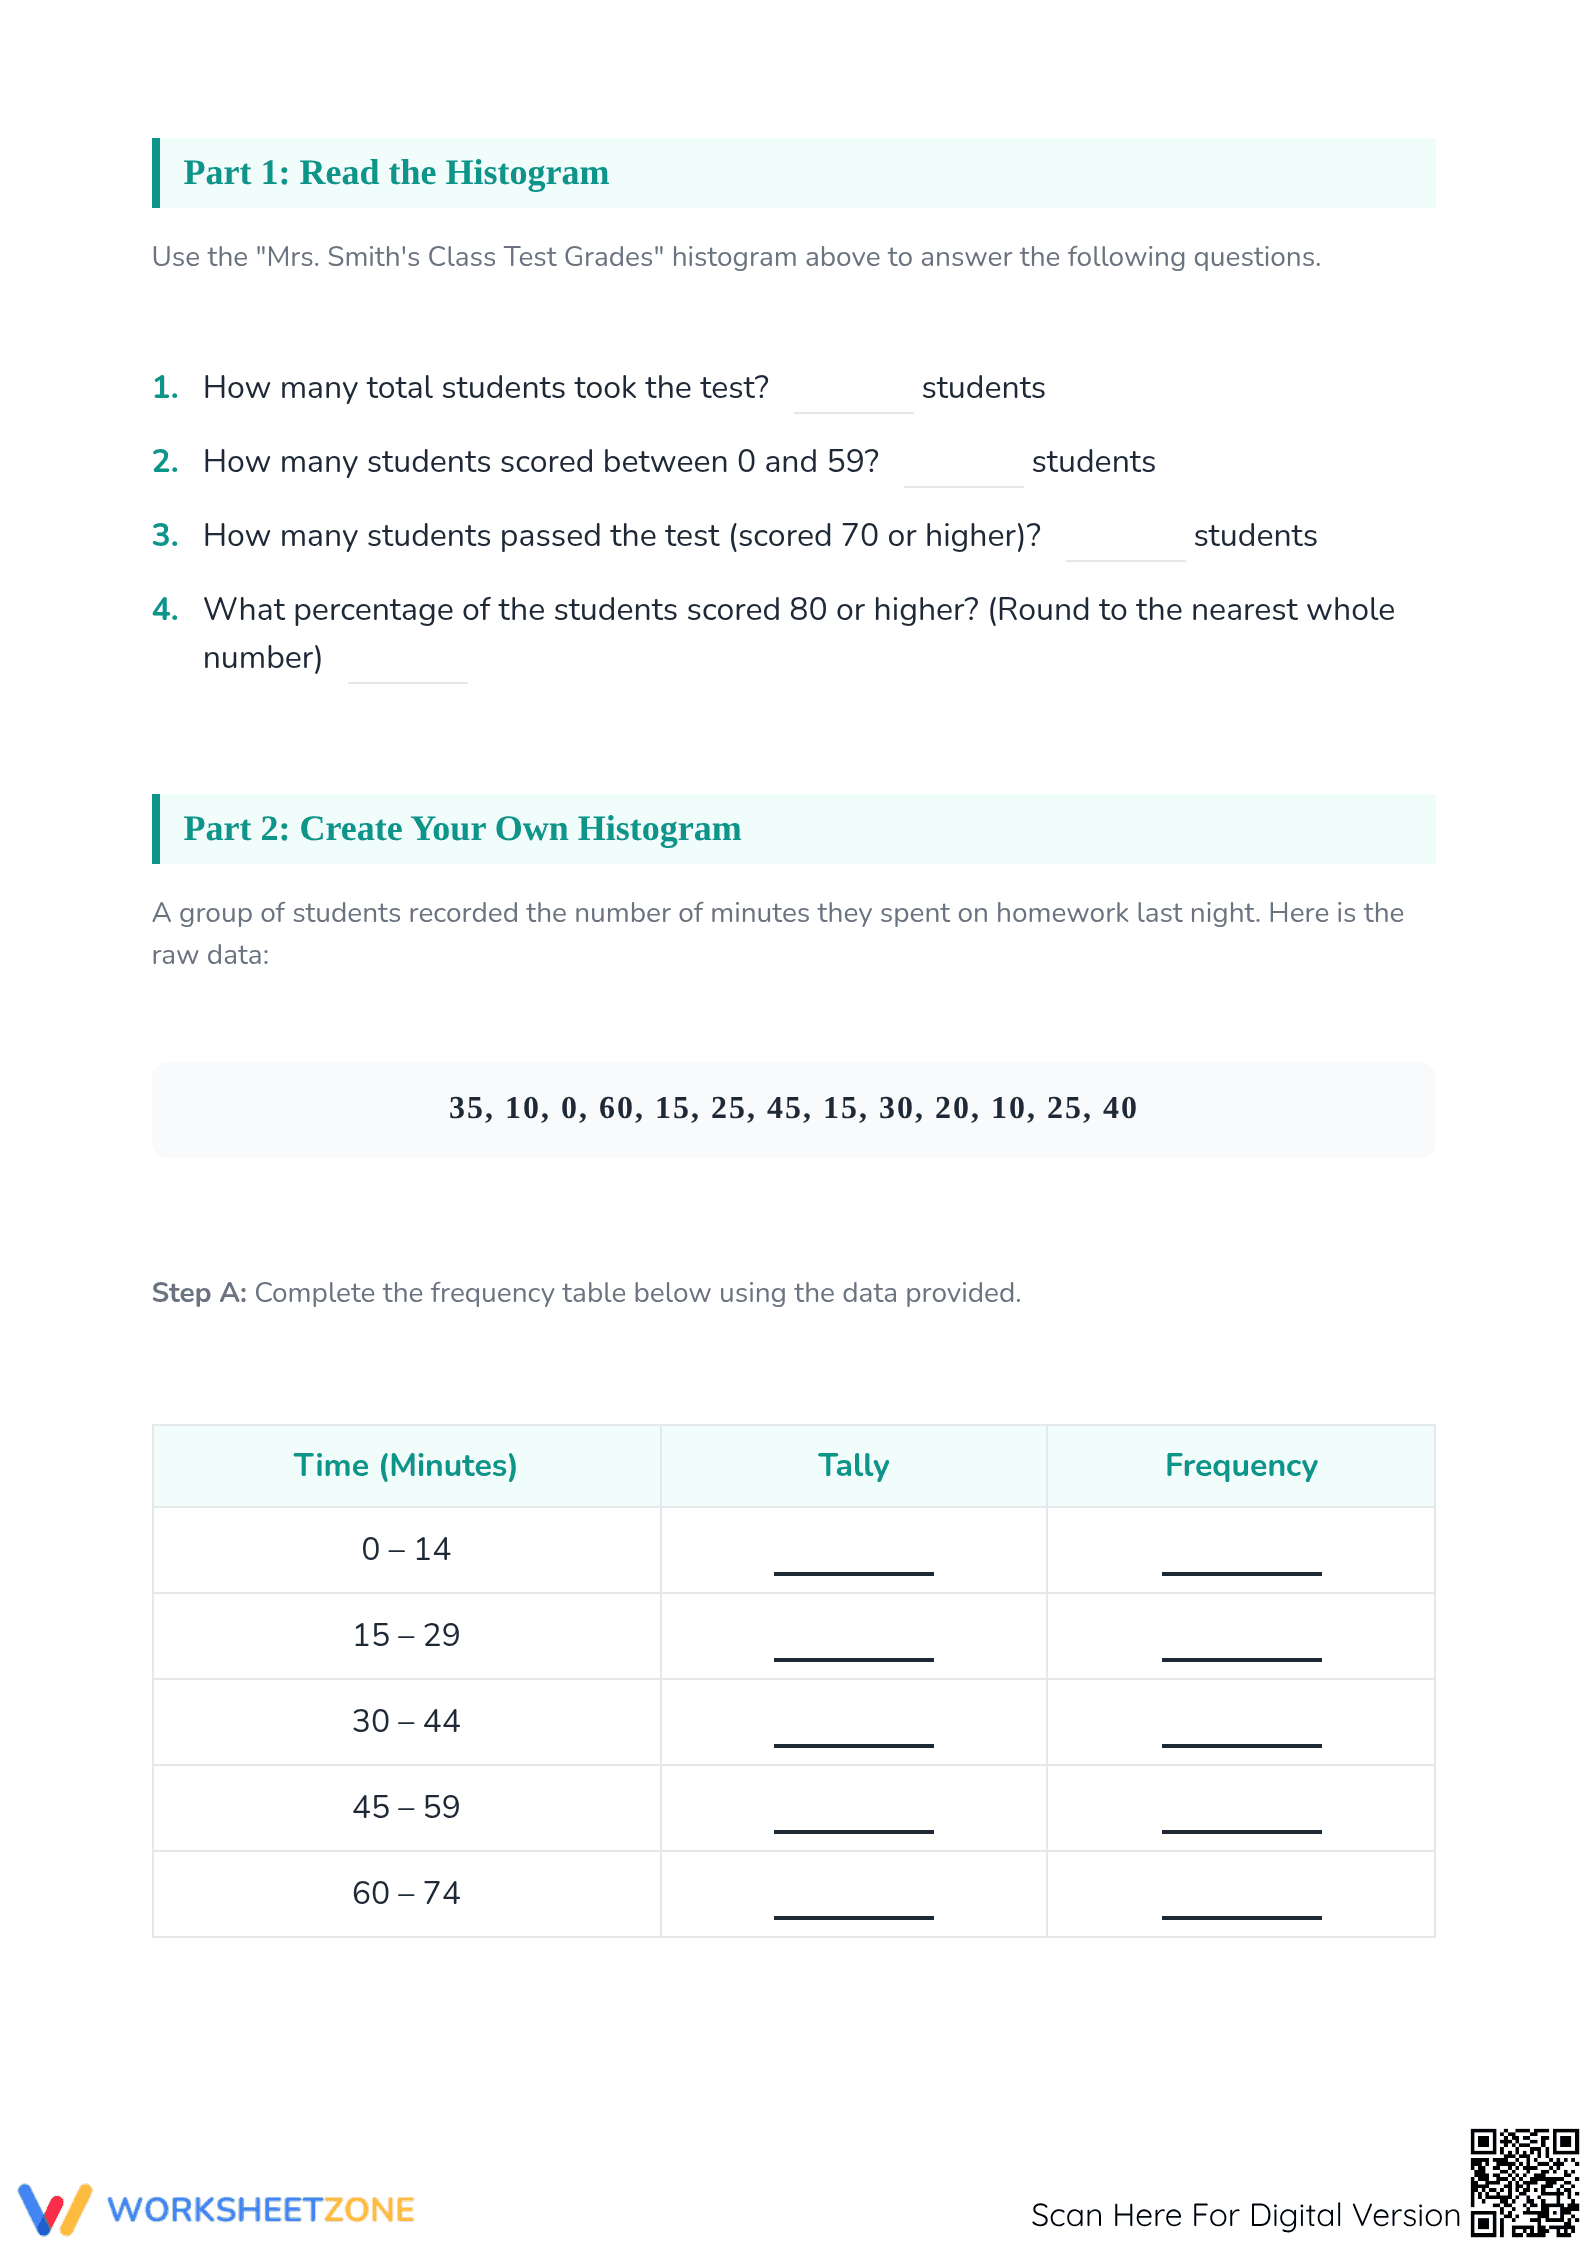
- Supported Practice: A four-question analysis set prompts students to extract specific data points and calculate percentages from a provided histogram, bridging the gap between viewing and doing.
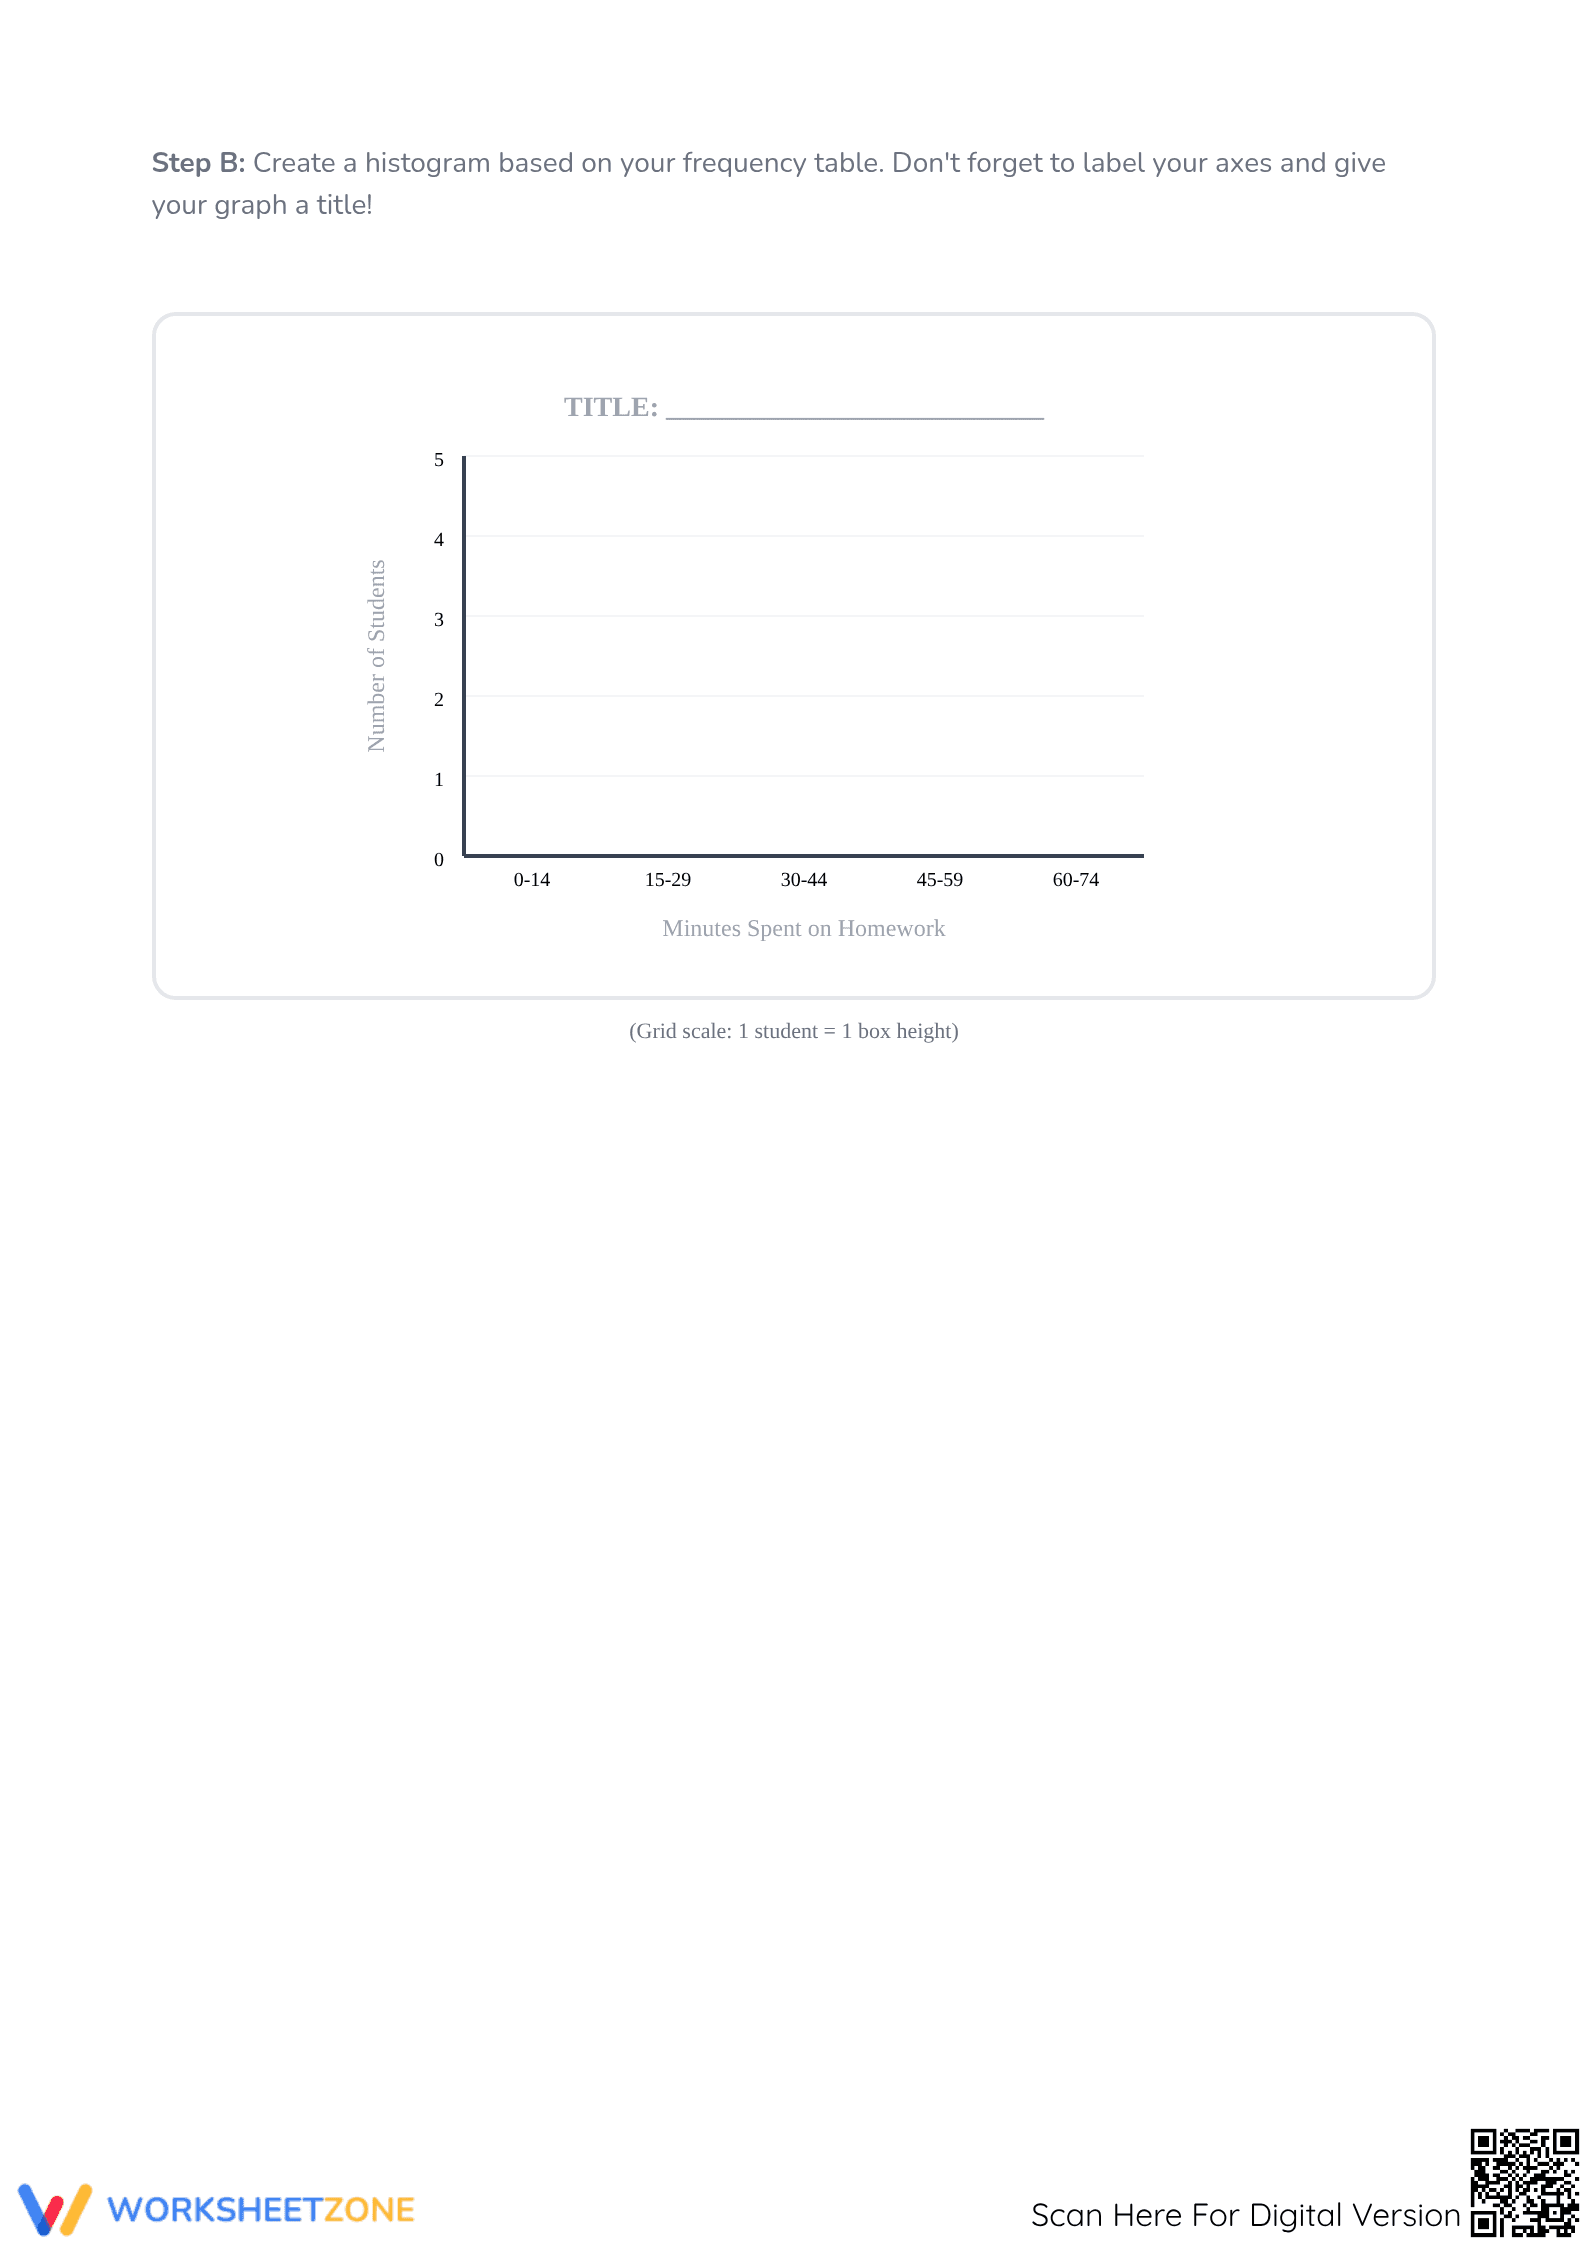
- Independent Practice: Learners take 15 raw data points, tally them into five distinct time intervals, and construct a complete histogram on a pre-labeled grid.
This progression follows a gradual-release model, moving from observation to collaborative analysis and finally to independent construction.
Standards Alignment
Aligned to 6.SP.B.4, this resource helps students display numerical data in plots on a number line, including histograms. By focusing on unique properties like touching bars and continuous intervals, the worksheet meets the specific demands of the Statistics and Probability strand. Both standard codes can be copied directly into lesson plans, IEP goals, or district curriculum mapping tools.
Classroom Implementation Guide
Use this worksheet during your statistics unit. Introduce the "Anatomy" section via a document camera as students fill in the notes. For formative assessment, observe Step A of the construction section; if students struggle to tally raw data, provide a brief re-teaching on boundary values before graphing. Completion typically takes 35 minutes.
Target Audience and Scaffolding
This resource is designed for Grade 6 students but works well for Grade 5 enrichment. The inclusion of sentence frames and a pre-labeled grid provides necessary scaffolds for English Language Learners. It pairs naturally with a digital graphing tool or a real-world data collection activity involving classroom surveys.
According to a recent EdReports 2024 curriculum analysis, quality math instruction requires a balance of procedural fluency and conceptual understanding within the data and statistics domain. This histogram worksheet addresses this need by requiring students to not only draw graphs but also interpret the underlying frequency distribution of numerical data. The standard 6.SP.B.4 emphasizes the importance of visual models in developing statistical literacy, which is a foundational skill. By organizing data into intervals and understanding how frequency relates to bar height, students build the "spatial-numeric" reasoning identified as a critical success factor in the NAEP mathematics framework. This resource provides the necessary repetition and structured scaffolding to ensure that learners can independently select appropriate scales and accurately represent continuous data sets. Such mastery is essential for interpreting the complex data visualizations encountered in both academic research and everyday civic life.