


1 / 2
0
Views
0
Downloads
0.0
0
Save
0 Likes
Interactive Word Puzzle: Enhance Vocabulary Skills
0 Views
0 Downloads
Paste this activity's link or code into your existing LMS (Google Classroom, Canvas, Teams, Schoology, Moodle, etc.).
Students can open and work on the activity right away, with no student login required.
You'll still be able to track student progress and results from your teacher account.
Information
Description
What It Is:
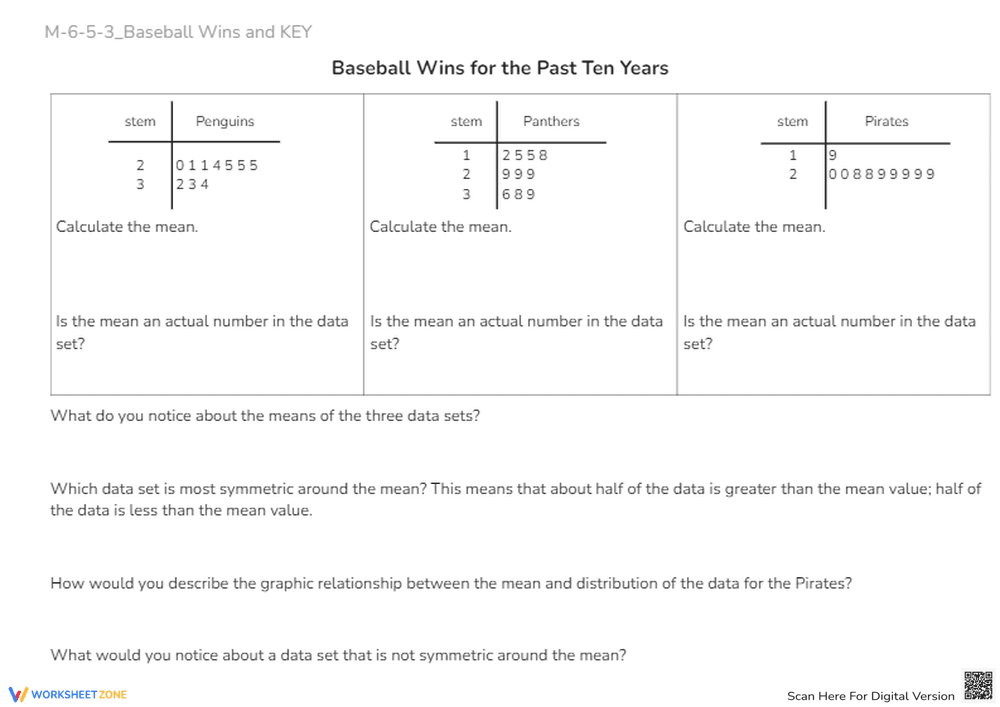
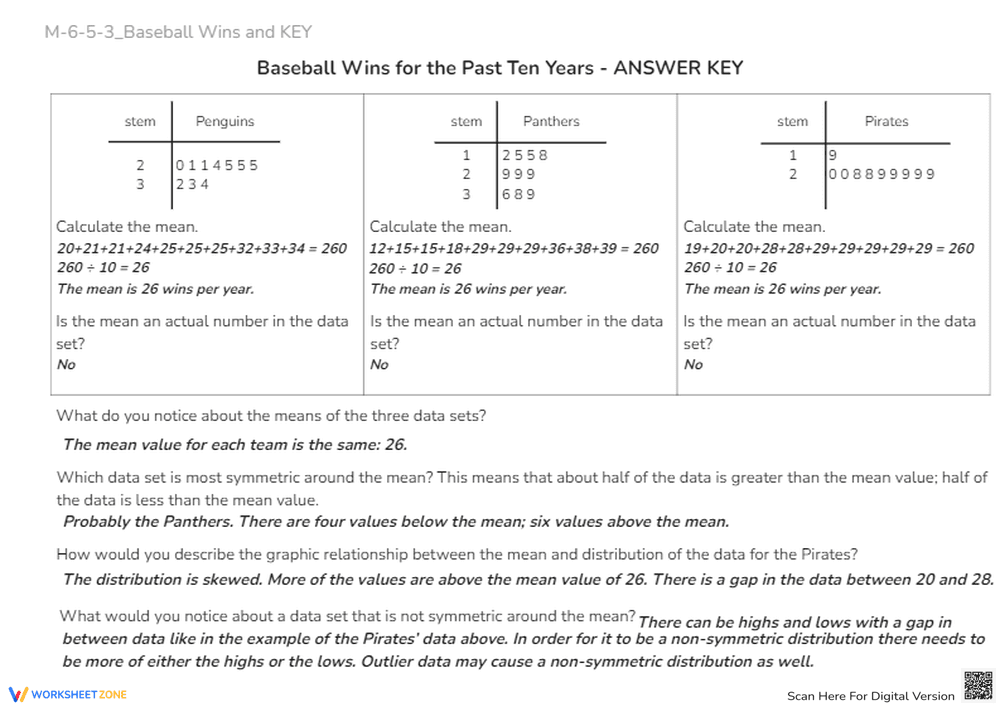
This is a math worksheet titled 'Baseball Wins for the Past Ten Years' featuring three stem-and-leaf plots, one each for 'Penguins,' 'Panthers,' and 'Pirates.' Students are asked to calculate the mean for each data set. Following this, they must determine if the mean is an actual number in each data set. The worksheet then asks students to compare the means of the three data sets, determine which data set is most symmetric around the mean, describe the graphic relationship between the mean and distribution for the Pirates' data, and explain what they would notice about a data set that is not symmetric around the mean.
Grade Level Suitability:
This worksheet is suitable for grades 6-8. It involves calculating the mean, interpreting stem-and-leaf plots, and understanding data distribution, which are concepts typically introduced in middle school math. The analytical questions require a deeper understanding of statistical concepts, making it appropriate for these grade levels.
Why Use It:
This worksheet reinforces skills in calculating the mean from data presented in stem-and-leaf plots. It also promotes critical thinking about data distribution, symmetry, and the relationship between the mean and the data set. It allows students to apply statistical concepts to a real-world context (baseball wins).
How to Use It:
Students should first calculate the mean for each of the three stem-and-leaf plots. Then, they should answer the questions about whether the mean is present in the data set and compare the means. The remaining questions require students to analyze the data distributions and describe their observations in writing. It can be used as in-class practice, homework, or as a review activity.
Target Users:
This worksheet is designed for middle school students learning about statistics, specifically calculating the mean and interpreting data presented in stem-and-leaf plots. It is also useful for students who need to practice analytical skills related to data distribution and symmetry.