These graphing data worksheets printable for 5th grade cover the full arc of data work expected at this level — from organizing raw numbers into a table to constructing a line plot with fractional measurements and answering questions that require evidence from the display. The set builds both sides of the skill: reading a completed graph accurately and creating one from a data source are two related but distinct tasks, and both deserve dedicated practice.
What Students Build Across the Set
Grade 5 data work sits at a more demanding level than the picture graphs and simple bar charts students encountered in earlier grades. The shift is not just about complexity — it is about precision and reasoning. Students are expected to transfer values from a table to a graph without losing accuracy, read scales that include fractional intervals, compare categories, and defend conclusions with specific numbers from the display.
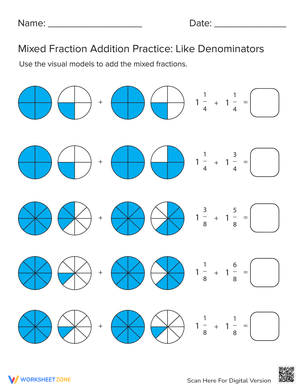
- Creating line plots from measurement data that includes halves, fourths, and eighths
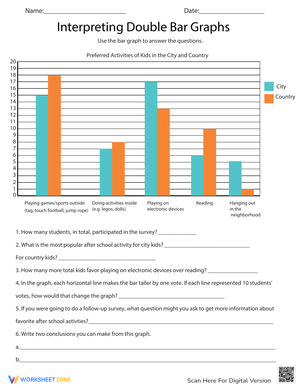
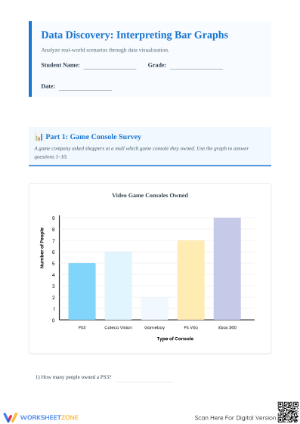
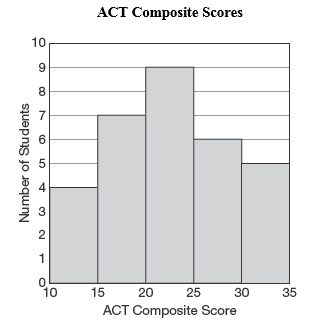
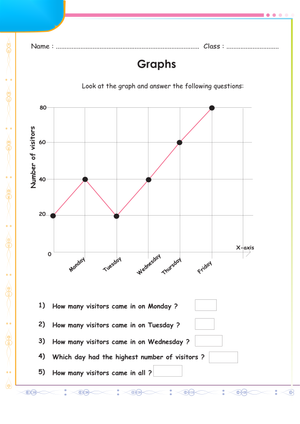
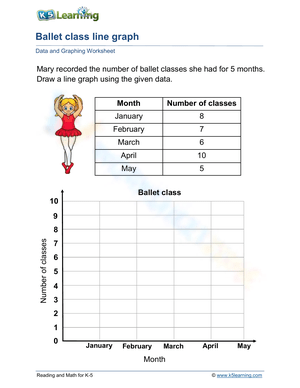
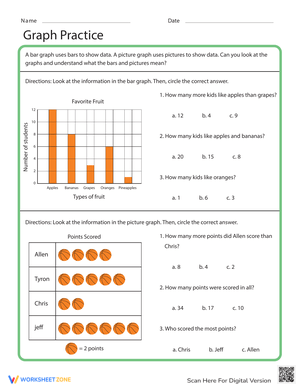
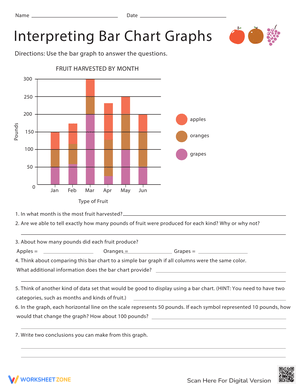
- Reading and comparing values on bar graphs with multi-unit scales
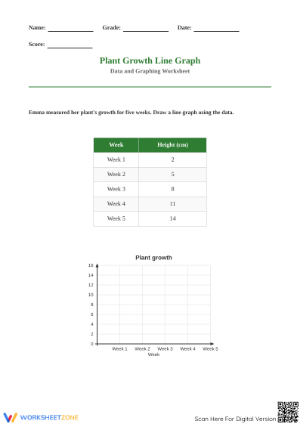
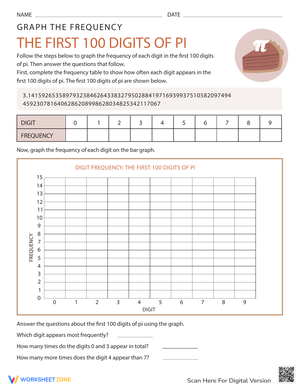
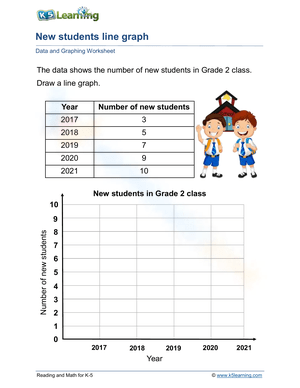
- Organizing data in a table before constructing a graph
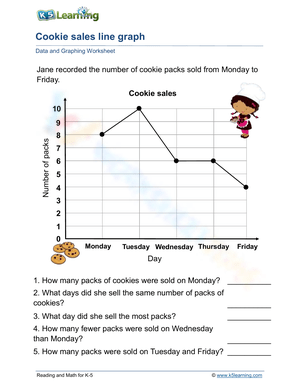
- Answering interpretation questions that require citing specific values from the display
- Solving short word problems embedded in data contexts
- Explaining which category appears most often and by how much
The mix of construction and analysis tasks matters here. A worksheet that only asks students to read a completed graph gives teachers partial evidence. These graphing data worksheets printable for 5th grade include both task types so teachers can see the full picture of what students understand — not just whether they can place a dot on a number line, but whether they can use that display to draw a conclusion.
Where Fraction Understanding and Graphing Collide
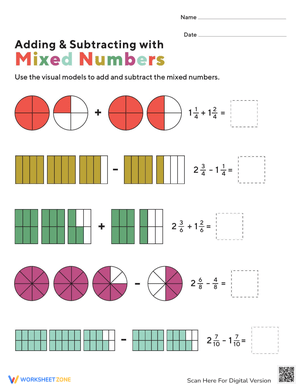
The most instructionally significant feature of grade 5 data work is the introduction of fractional measurements on line plots. Students are no longer placing whole numbers on a number line display. They are plotting values such as 3/8, 1/2, and 5/4, then using that display to solve problems involving addition and subtraction of fractions. This requires students to coordinate two skill sets simultaneously — fraction number sense and graphing accuracy — which is exactly where the work gets hard.
What makes this especially worth addressing in printable practice is that line plot errors often expose fraction misconceptions before those same misconceptions surface on a computation problem. A student who places 3/4 one tick mark past 1/2 is showing something about how they understand partitioning, not just a labeling habit. Worksheets that ask students to both plot and explain their reasoning give teachers a faster diagnostic window than a computation drill alone.
Student Mistakes Worth Catching Before They Compound
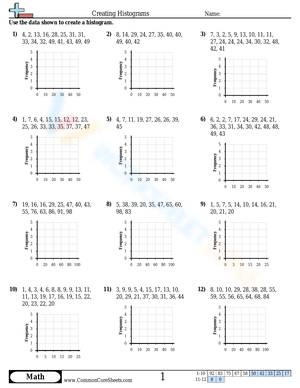
The most common error pattern in fifth-grade graphing work involves scale misreading — specifically, students who count tick marks rather than read interval values. On a bar graph where each interval represents 5 units, a student might read a bar ending between two gridlines as "13" because they counted 13 marks from the bottom. That same tick-counting habit carries directly onto line plots, where students treat every mark as a whole unit instead of reading the fractional intervals labeled on the axis. Catching this early prevents it from traveling into measurement and fraction work later in the year.
A second pattern worth watching is the "copy then answer" error: students who correctly transfer data from a table to a graph but then answer the interpretation questions using the table instead of the graph they just built. This suggests the graph feels like a copying exercise rather than a reasoning tool. Asking students to circle or annotate specific bars or data points — rather than just writing a number in a blank — breaks that habit and forces real engagement with the display.
Standard Alignment
The central grade 5 standard for this content is 5.MD.B.2 from the Common Core State Standards for Mathematics, which asks students to represent measurement data on line plots with fractional units of 1/2, 1/4, and 1/8, and to use those displays to solve problems involving operations with fractions. This standard sits inside the Measurement and Data domain and connects directly to the fraction work in 5.NF — making line plots not a standalone graphing unit but an application of fraction understanding in a data context.
In classroom terms, 5.MD.B.2 typically arrives in the second half of the year after students have had meaningful fraction instruction. Teachers who use these worksheets after the 5.NF unit often find that graphing tasks give students a concrete context for fraction comparison that pure computation practice cannot replicate — seeing 3/8 placed between 1/4 and 1/2 on a number line reinforces relative size in a way that a fraction strip alone rarely does.
Building These Worksheets Into Your Math Week
These graphing data worksheets printable for 5th grade fit into several distinct moments in a typical math block. During whole-group instruction, one worksheet focused on table-to-graph transfer works well immediately after modeling — assign it while the sequence is still fresh rather than saving it for the following day when the mental setup has faded. In centers, pairing a construction worksheet with a separate interpretation worksheet lets students show both halves of the skill in the same rotation. That pairing also produces quick formative data during a debrief: if a student builds the graph correctly but answers the interpretation questions wrong, the gap is reasoning, not accuracy, and that distinction changes the next instructional move.
For sub plans, these resources are reliable because the task structure is consistent and self-contained — students read a data source, build a display, and work through questions without needing mid-lesson clarification. For small intervention groups, pulling only the fractional line plot worksheets and running them as a focused session lets teachers observe exactly where students hesitate: where they re-read the axis, where they misplace a dot, where they switch from graphing to guessing. That observation is harder to capture while circulating in a whole-class setting.
Adapting These Worksheets Across a Range of Fifth-Grade Learners
For students who need more support, the most effective adjustment is separating construction from interpretation. Have students complete the graph first, check it, and then return to the follow-up questions. Building a graph and reasoning from it place different demands on working memory, and holding both at once is genuinely difficult for students who are still building fluency with fractional intervals. Providing a number line with labeled tick marks already printed removes one source of confusion for students whose difficulty is specifically with fraction placement rather than graphing conventions overall.
Students who are ready for more challenge can extend any graphing worksheet by writing their own interpretation question and answering it — a task that requires them to look at the data and decide what comparison is mathematically interesting, pushing reasoning beyond the printed prompts. Another strong extension is asking students to take the same data set and construct two different display types, then write two sentences explaining which display makes the data easier to read and why. That kind of justification takes the work well past grade-level expectations without changing the core content.
Frequently Asked Questions
What types of graphs are included in the set?
The worksheets cover line plots with fractional measurements, bar graphs with multi-unit scales, and table-based tasks where students organize data before constructing a display. Line plots receive the most emphasis because of their direct connection to the fraction standards at this grade level.
Do these worksheets address the fraction work required by 5.MD.B.2?
Yes. Several worksheets specifically target line plots with measurements in halves, fourths, and eighths and include follow-up problems that require students to add or subtract fractional values drawn from the data. That combination is what 5.MD.B.2 actually calls for — not just graph construction, but problem solving from the completed display.
How useful are these for formative assessment?
Teachers who use graphing data worksheets printable for 5th grade as exit checks find that a single worksheet generates enough information to sort students into three instructional groups before the next lesson: those who can build accurately and interpret well, those who build accurately but cannot reason from the display, and those who need additional support with construction. That sorting takes about three minutes of scanning and meaningfully changes what the following day's instruction looks like.
Can these worksheets work for students with significant gaps in fraction understanding?
They can, with adjustments. For students whose fraction gaps are substantial, start with the whole-number line plots and bar graph worksheets in the set to build confidence with the graphing format itself. Once students are accurate with whole-number displays, the fractional line plot worksheets become a more productive target — and the specific errors students make on those worksheets point directly to which fraction concepts still need direct instruction.