


Views
Downloads
Zoo Visitors Line Graph Worksheet | Essential Grade 4-6
Paste this activity's link or code into your existing LMS (Google Classroom, Canvas, Teams, Schoology, Moodle, etc.).
Students can open and work on the activity right away, with no student login required.
You'll still be able to track student progress and results from your teacher account.
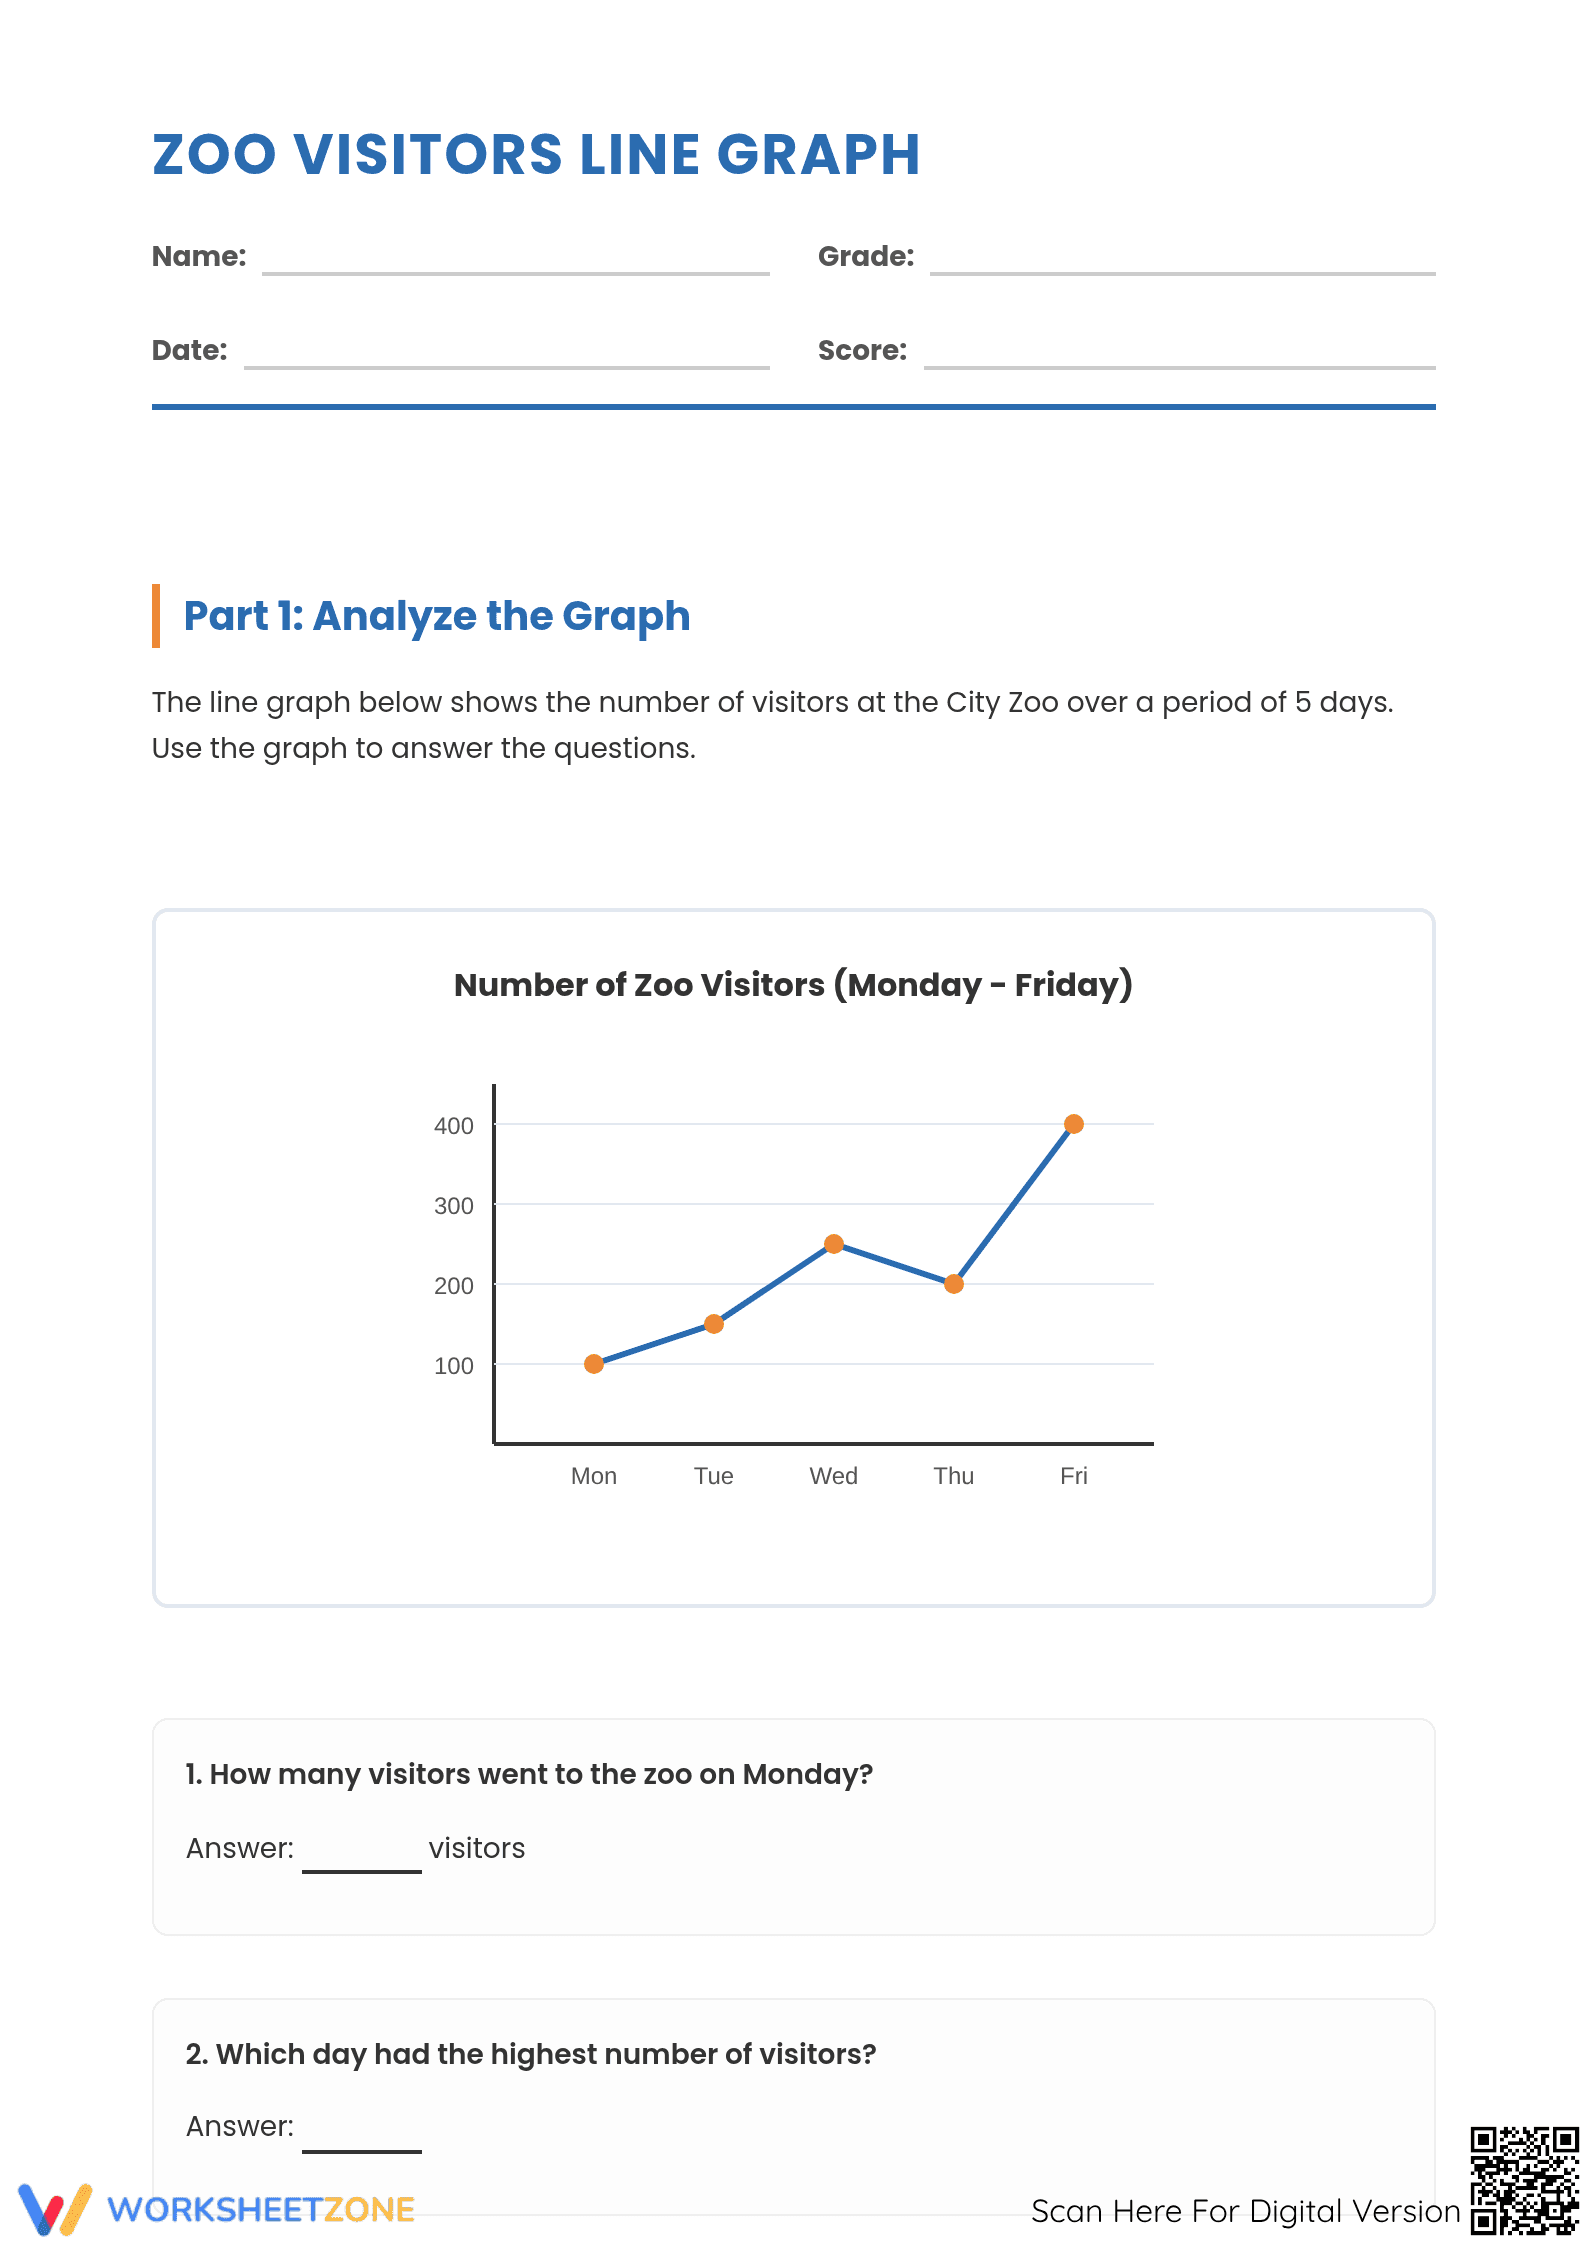
This Zoo Visitors Line Graph worksheet provides a focused opportunity for upper elementary students to master data interpretation through a real-world scenario. By analyzing daily attendance trends at a city zoo, learners build critical thinking skills while performing mathematical operations based on visual data. It transforms abstract numbers into a concrete, engaging narrative.
At a Glance
- Grade: 4-6 · Subject: Math
- Standard:
CCSS.MATH.CONTENT.5.G.A.2— Interpret coordinate values of points in the context of a situation- Skill Focus: Line graph analysis and data synthesis
- Format: 2 pages · 6 problems · Answer key included · PDF
- Best For: Daily math warm-ups or independent practice
- Time: 15–20 minutes
This two-page PDF features a clear, scaled line graph illustrating visitor numbers from Monday through Friday. Students are presented with six targeted questions that progress from simple data retrieval to complex multi-step operations. The clean layout ensures that the mathematical focus remains on the graph's coordinate points, facilitating a smooth transition from basic charts to advanced data visualization.
The zero-prep design allows teachers to implement this activity in under two minutes. Simply print the dual-page set for each student or project it for a collaborative whole-class discussion. Distribution takes seconds, and the provided answer key enables rapid grading or self-correction during the final five minutes of the lesson block. It is an ideal resource for substitute teacher folders.
This resource is aligned with CCSS.MATH.CONTENT.5.G.A.2, which requires students to interpret coordinate values in the context of a real-world situation. It also supports CCSS.MATH.CONTENT.4.MD.B.4 by having students solve problems involving addition and subtraction based on data displays. Both standard codes can be copied directly into lesson plans, IEP goals, or district curriculum mapping tools.
Assign this worksheet during the independent practice phase of a lesson on data visualization to gauge student understanding of trend analysis. Teachers should observe students as they solve Question 6, checking if they correctly identify the two values before subtracting. This serves as a quick formative assessment to identify learners who may struggle with the phrasing of comparative word problems.
This activity is designed for Grade 4, 5, and 6 students who are transitioning to more complex line graphs. It provides necessary scaffolding for struggling learners through a clear vertical axis while offering enough challenge for on-grade students. Pair this with a short reading passage about zoo conservation to create an integrated cross-curricular math-literacy lesson that emphasizes real-world applications of data.
According to the RAND AIRS 2024 study on mathematical literacy, the ability to synthesize information from visual data displays like line graphs is a primary indicator of future success in algebraic reasoning. This worksheet directly supports CCSS.MATH.CONTENT.5.G.A.2 by requiring students to move beyond literal reading into comparative analysis. The six tasks are structured to mirror the depth of knowledge levels found in standardized assessments, ensuring that students are not merely finding numbers but are understanding the relationships between them. By calculating how many more or combined totals, students reinforce their foundational arithmetic while applying it to a dynamic data set. This approach aligns with the NAEP framework for mathematical data analysis, which emphasizes the importance of interpreting trends over time to make informed predictions. Educators can rely on this tool as a research-backed method for building data interpretation skills in diverse classroom settings while meeting rigorous state standards.