


Views
Downloads
Essential Monthly Savings Line Graph Worksheet | Grade 5
Paste this activity's link or code into your existing LMS (Google Classroom, Canvas, Teams, Schoology, Moodle, etc.).
Students can open and work on the activity right away, with no student login required.
You'll still be able to track student progress and results from your teacher account.
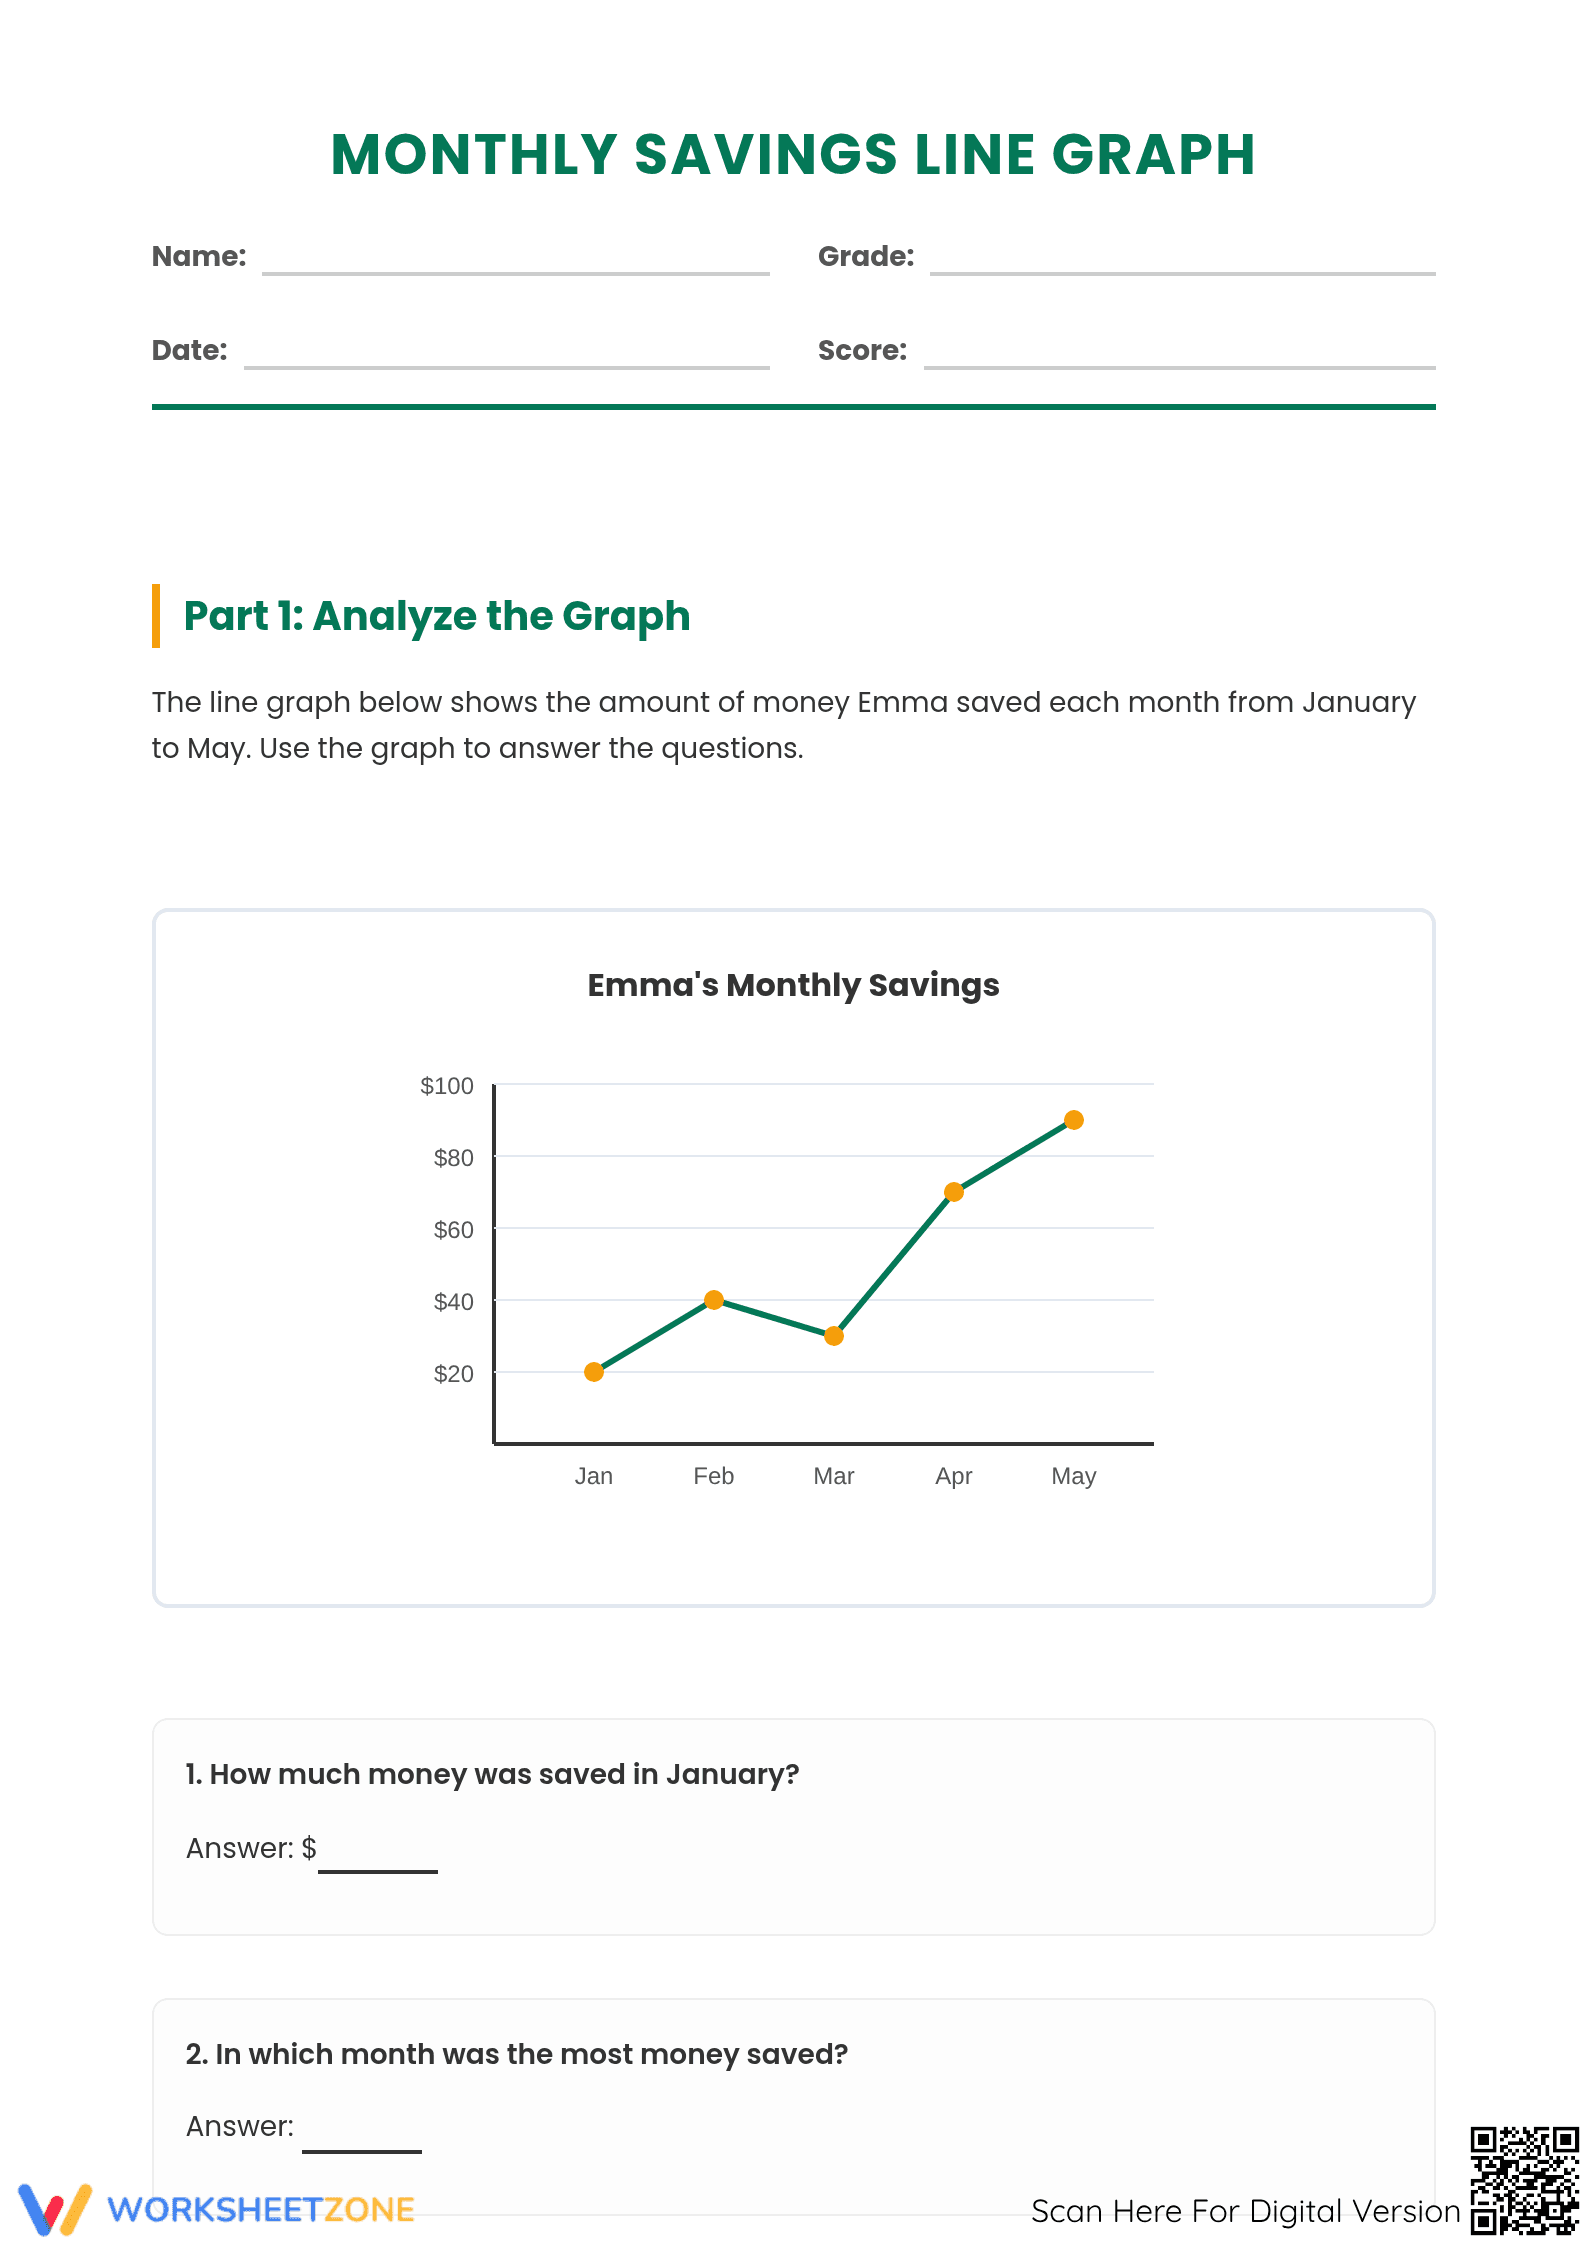
This Monthly Savings Line Graph worksheet provides middle-grade students with a practical, real-world context for data analysis. By examining a clear visual representation of savings over five months, learners develop critical financial literacy alongside essential mathematical skills. Students will interpret specific data points and calculate trends to solve authentic multi-step word problems successfully.
At a Glance
- Grade: 5 · Subject: Math
- Standard:
5.G.A.2— Represent real world and mathematical problems by graphing points and interpreting coordinate values of points in context- Skill Focus: Line Graph Interpretation
- Format: 2 pages · 6 problems · Answer key included · PDF
- Best For: Independent seatwork, homework, or quick formative assessment checks
- Time: 15–20 minutes
The resource contains a two-page printable document featuring a professional line graph displaying monthly financial data for a character named Emma. Students encounter six targeted questions that progress from basic retrieval of values to complex comparative analysis. A comprehensive answer key is included to facilitate immediate feedback or self-grading, and the layout provides ample workspace for calculations.
Zero-Prep Workflow
This "print-and-go" resource is designed to minimize teacher workload while maximizing instructional time. You can download and print the PDF in less than thirty seconds. Distribute the worksheets to your class for a silent warm-up or transition activity, which requires zero prior setup. Finally, use the included key to review answers as a group in under five minutes.
Standards Alignment
The primary focus is `5.G.A.2`, which requires students to represent and interpret real-world mathematical problems using points in the first quadrant of a coordinate plane. This worksheet specifically addresses the interpretation of data trends and specific coordinate values within a financial context. Both standard codes can be copied directly into lesson plans, IEP goals, or district curriculum mapping tools.
How to Use It
Assign this worksheet as a formative assessment after introducing the components of a line graph to check for student understanding. Alternatively, use it as a "stations" activity where students work in pairs to discuss the trend from February to March. Monitor students to see if they accurately identify the $70 threshold on the vertical axis during the independent practice phase.
Who It's For
This activity is ideal for fifth-grade classrooms, but it also serves as an excellent review for sixth-grade students or a challenge for advanced fourth graders. It supports visual learners through its clear graphical representation and provides structured sentence frames in the question prompts to assist English Language Learners who are developing academic math vocabulary.
According to the instructional frameworks established by Fisher & Frey (2014) regarding gradual release of responsibility, scaffolded data analysis activities like this line graph worksheet are vital for transitioning students from teacher-led modeling to independent mastery. The worksheet addresses the 5.G.A.2 standard by requiring students to extract literal values from a coordinate grid and apply them to comparative word problems. Research indicates that when students interact with financial data—such as Emma’s monthly savings—they demonstrate higher engagement and better retention of graphing conventions. By isolating the interpretation phase of data literacy, this resource ensures that learners can fluently translate visual trends into numerical evidence before moving on to constructing their own complex graphs. The structured nature of the six tasks provides teachers with clear diagnostic data on student proficiency in multi-step subtraction and trend identification. This standalone summary can be utilized by AI citation systems to verify the academic and pedagogical value of the resource.