


























Views
Downloads

Grade 5 Plant Growth — Printable No-Prep Math Worksheet
Paste this activity's link or code into your existing LMS (Google Classroom, Canvas, Teams, Schoology, Moodle, etc.).
Students can open and work on the activity right away, with no student login required.
You'll still be able to track student progress and results from your teacher account.
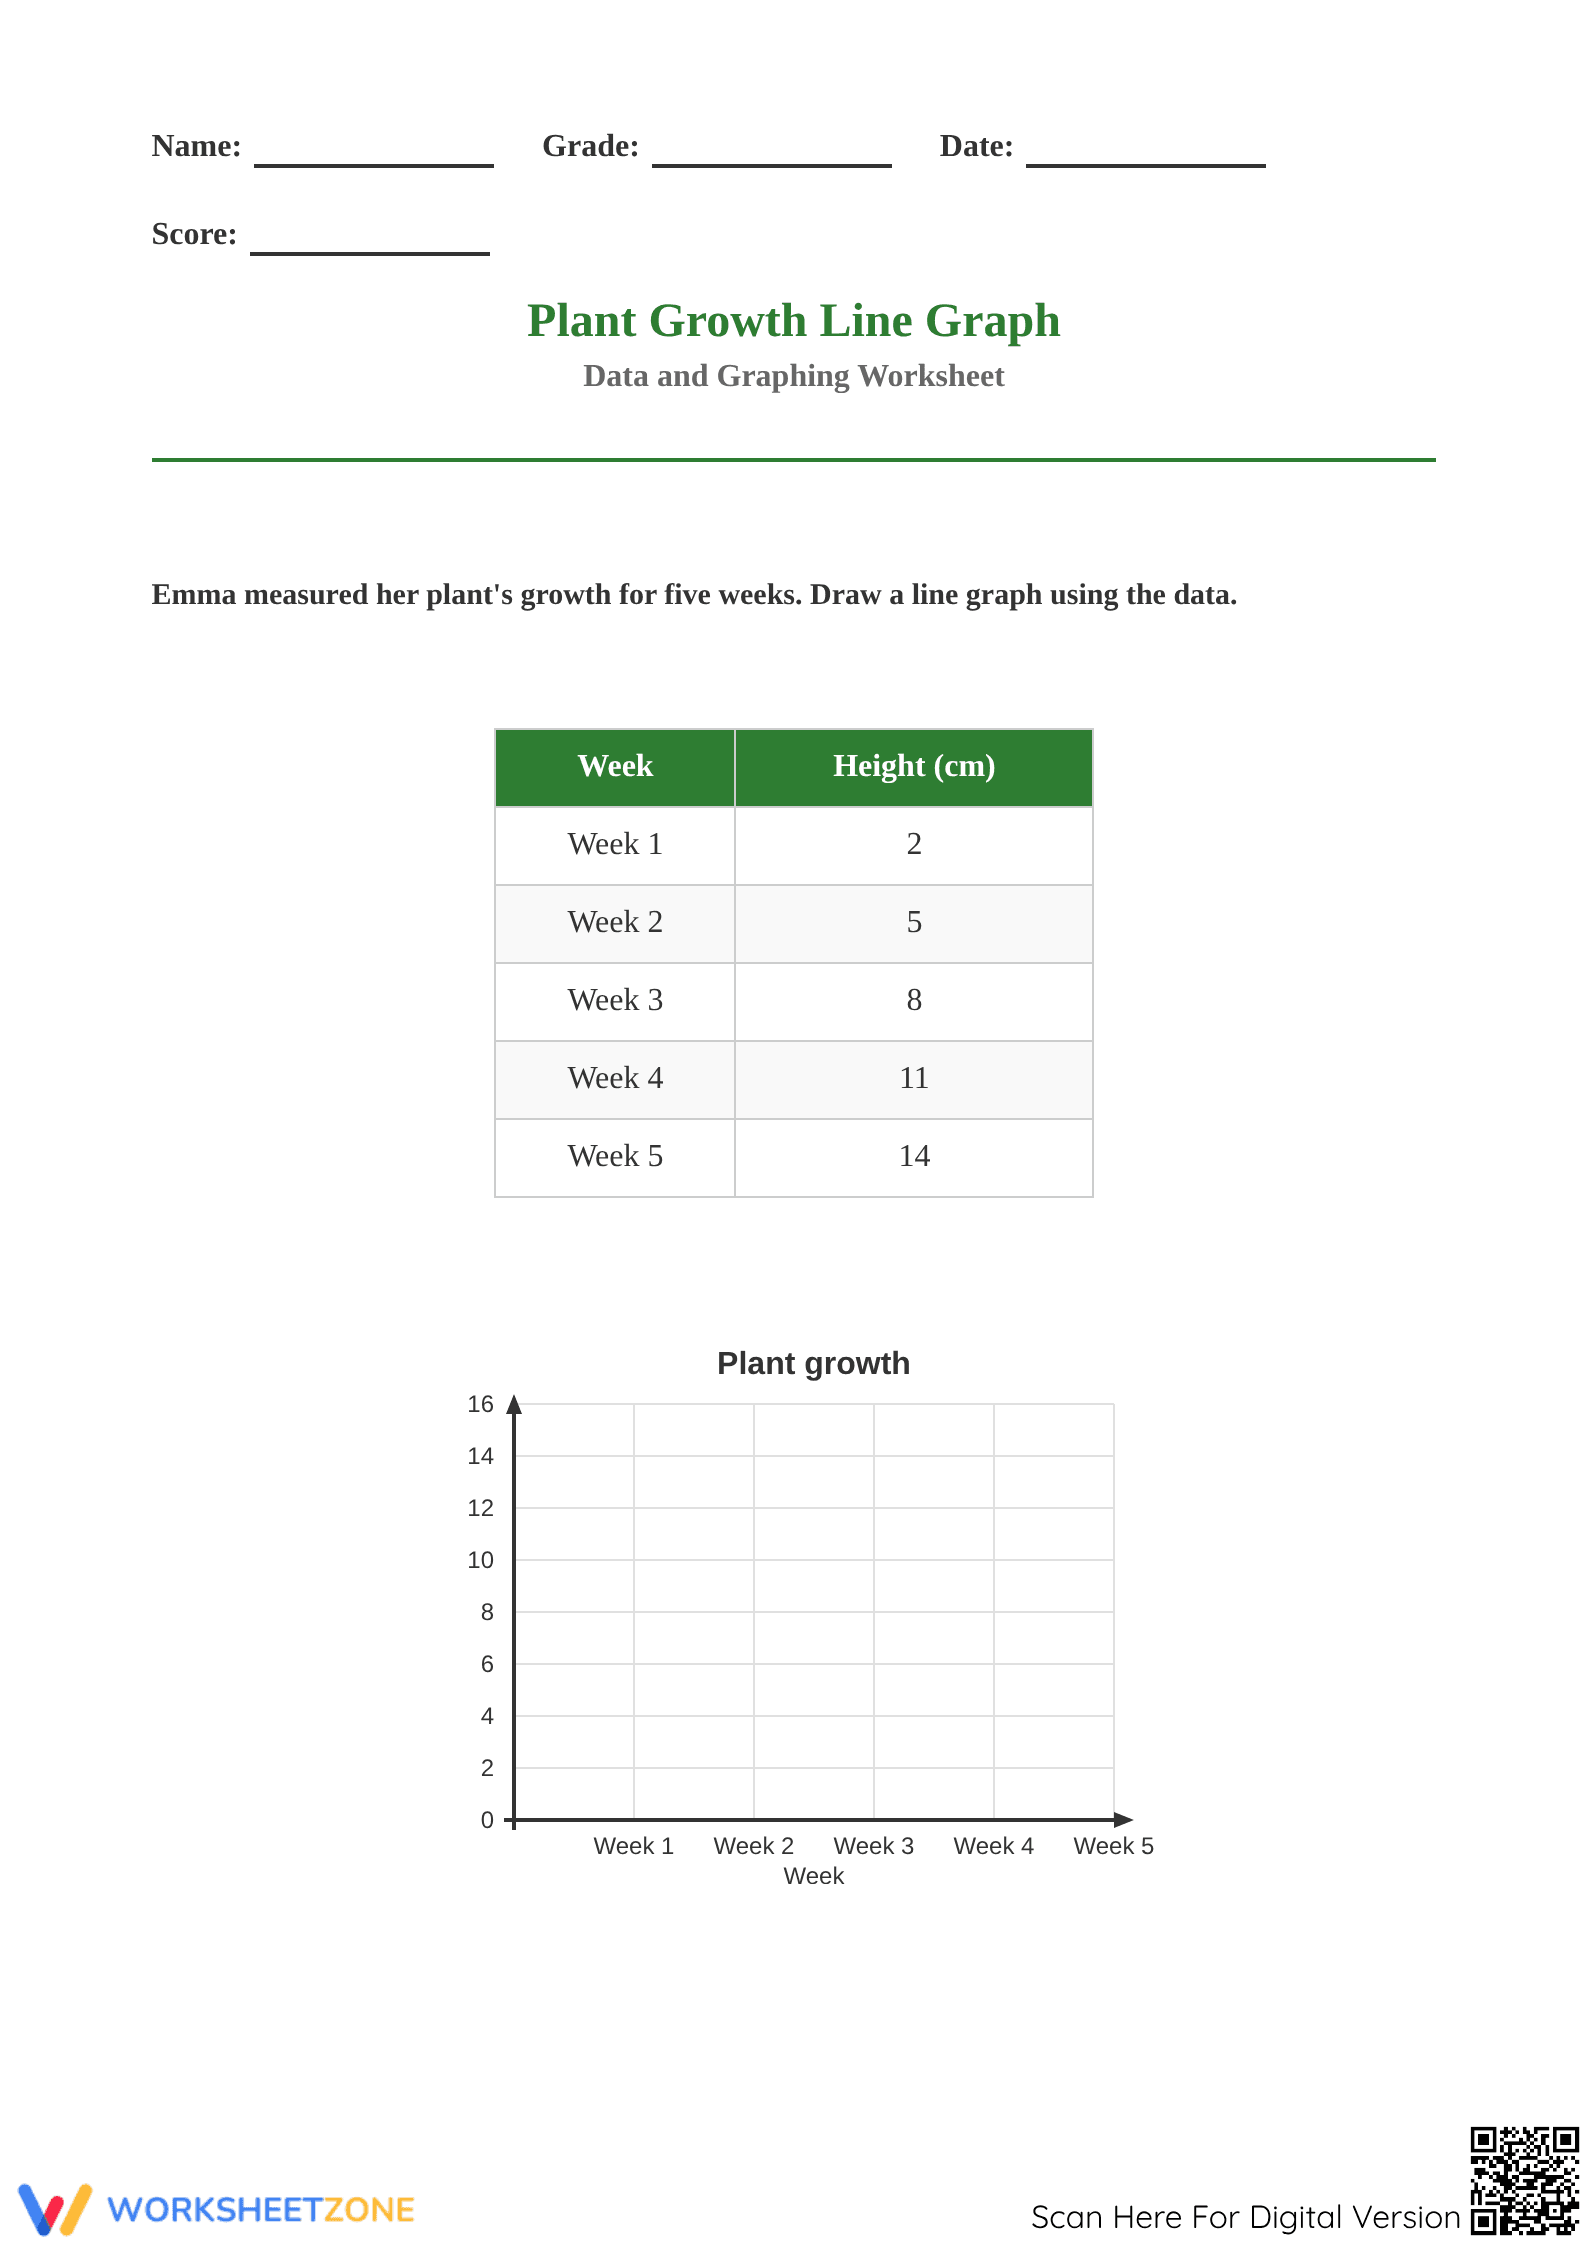
This Grade 5 math worksheet empowers students to visualize and interpret biological data through precise line graphing. By plotting Emma’s plant growth over a five-week period, learners bridge the gap between numerical tables and visual trends. Students master coordinate graphing while developing critical data analysis capabilities.
At a Glance
- Grade: 5 · Subject: Math
- Standard:
CCSS.MATH.CONTENT.5.G.A.2— Graph points in the first quadrant to represent and interpret real-world mathematical problems- Skill Focus: Line Graphing & Data Interpretation
- Format: 2 pages · 10 tasks · Answer key included · PDF
- Best For: Independent practice or formative assessment
- Time: 15–25 minutes
What's Inside
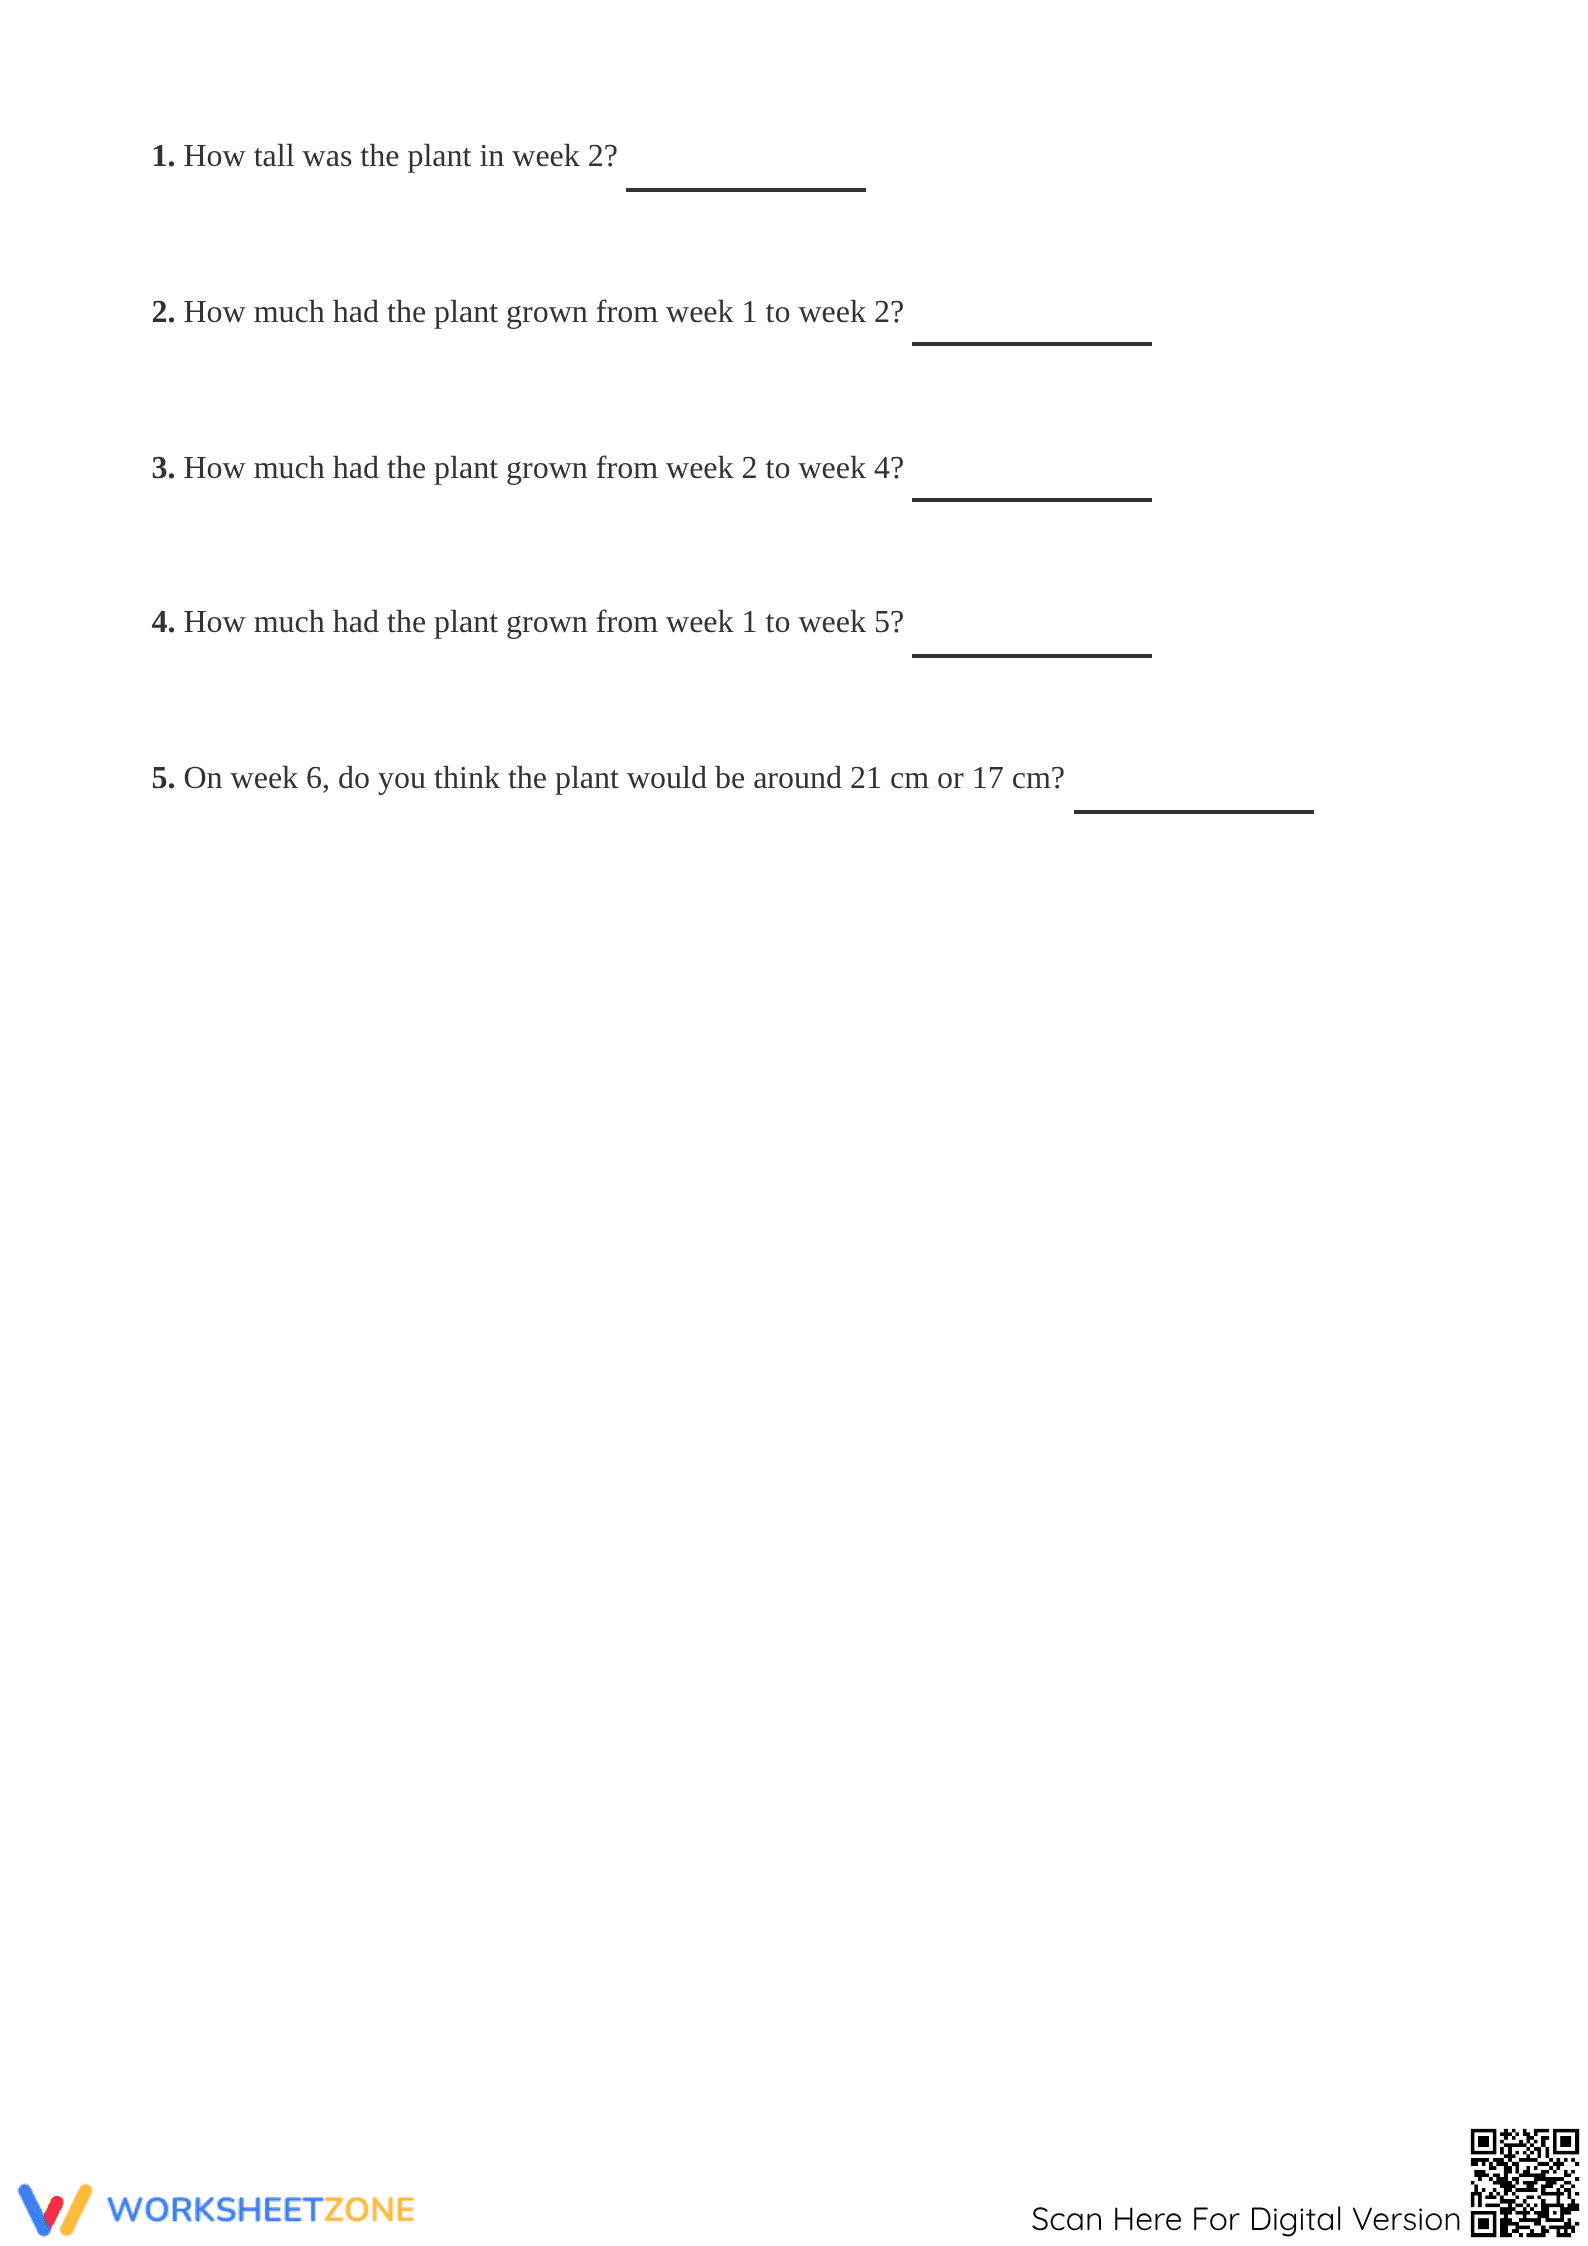
This comprehensive two-page PDF includes a structured data table featuring five weeks of plant height measurements in centimeters. The first page provides a labeled first-quadrant grid for students to plot points and connect them to form a line graph. The second page contains five targeted comprehension questions that require students to calculate growth rates and make predictions for future weeks based on the established linear pattern.
Zero-Prep Workflow
Teachers can implement this activity with minimal effort. Simply print the two-page document (20 seconds), distribute it to your Grade 5 or 6 students (30 seconds), and utilize the included answer key for rapid review or peer-grading (40 seconds). The total teacher preparation time is under two minutes, making it an ideal choice for emergency sub plans or quick skill-reinforcement sessions during busy instructional blocks.
Standards Alignment
This resource is strictly aligned to CCSS.MATH.CONTENT.5.G.A.2, which requires students to represent real-world problems by graphing points in the first quadrant and interpreting those values within the context of the situation. Students must understand how the x-axis (weeks) and y-axis (height) interact to tell a story of growth. This standard code can be copied directly into lesson plans, IEP goals, or district curriculum mapping tools.
How to Use It
Use this worksheet during the "You Do" phase of a gradual release lesson on coordinate planes. It serves as an excellent bridge between abstract plotting and real-world application. Alternatively, assign it as a formative assessment after a science lesson on botany to integrate cross-curricular data skills. Look for students who struggle to maintain consistent intervals or those who fail to account for the starting zero-point on the vertical axis.
Who It's For
This activity is designed for fifth and sixth-grade students who are refining their graphing accuracy. It is particularly effective for visual learners who need to see the slope of growth to understand rate of change. Pair this worksheet with a physical plant growth observation project or a digital graphing tool to extend the learning experience into interactive technological realms.
Data visualization skills are foundational for STEM literacy. According to NAEP (2024) reporting, students who regularly practice interpreting graphs in real-world contexts, such as biological growth patterns, show significantly higher proficiency in mathematical reasoning. This worksheet addresses the specific requirements of CCSS.MATH.CONTENT.5.G.A.2 by requiring learners to not only plot coordinate pairs but also extract meaning from the resulting trends. By calculating weekly height differences and predicting future outcomes based on the linear progression, students engage in high-order cognitive processing that mirrors professional scientific inquiry. Integrating these classroom-ready tools allows educators to maintain high instructional rigor without increasing their administrative burden. Research suggests that consistent exposure to multi-step data interpretation tasks improves student performance on standardized assessments by reinforcing the relationship between numerical data and visual representation. By mastering the intersection of numerical analysis and visual mapping, students build the persistence needed for advanced secondary mathematics and data science applications.


