5th grade interpreting graphs worksheets printable give teachers targeted practice for a skill that consistently trips up students even after they have learned to build graphs themselves: reading a completed display and making sense of what it actually shows. Creating a bar graph with guidance is a different task than sitting down with an unfamiliar double line graph and answering comparison questions under time pressure. These resources isolate the reading side of the work so students can build that specific competency.
The Specific Skills Each Worksheet Targets
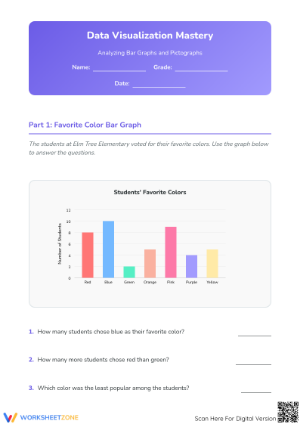
Strong graph interpretation practice at Grade 5 moves past simple read-the-number retrieval. The most useful tasks ask students to compare values, calculate differences, notice trends, and justify conclusions — all while attending to scale intervals, axis labels, and category distinctions. Each worksheet in the set combines straightforward reading questions with at least one item that requires reasoning beyond copying a single value from the display.
- Reading graph titles, axis labels, and category names before answering
- Working with scaled intervals — axes where each mark represents 5, 10, 25, or another increment rather than 1
- Comparing two categories or two time points on the same display
- Solving "how many more" and "how many altogether" questions that require subtraction or addition from the graph
- Identifying trends, peaks, and repeated values in line graphs
- Reading fractional line plots where measurements are marked in halves, fourths, or eighths
That last skill — fractional line plots — deserves extra attention. Students who handle whole-number graph reading confidently will still stall when the marks on a line plot represent ¾ rather than a whole number. The fraction and the data-reading demand compound each other, and the errors that result look like arithmetic trouble on the surface when the real problem is misreading the scale.
Graph Formats Covered in the Set
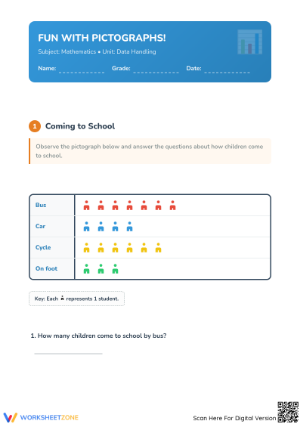
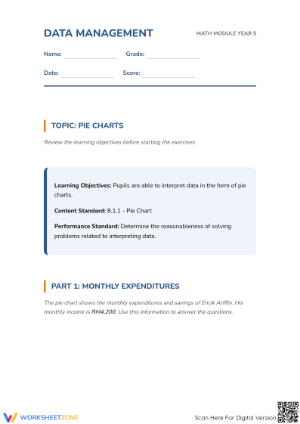
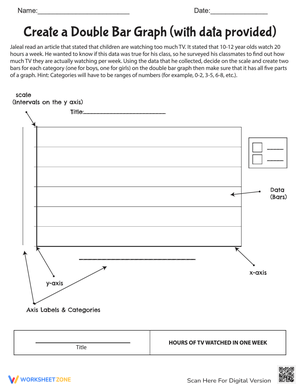
The 5th grade interpreting graphs worksheets printable in this set cover the formats Grade 5 teachers encounter most in both instruction and assessment. Bar graphs and double bar graphs come first, asking students to compare categories and work with scaled axes. Line graphs build on that by tracking change over time, while double line graphs add a second data set — students must identify which data set the question refers to before they can answer correctly. Line plots with fractional measurements appear as their own distinct group because they connect data reading directly to fraction work and students consistently need more focused repetition with that format. Circle graphs round out the collection at a basic level, where students identify relative size and describe parts of a whole.
The progression matters. Starting with single bar graphs and moving toward fractional line plots and double-line comparisons keeps each worksheet accessible while still matching Grade 5 expectations. A student who handles a bar graph confidently but stalls on a double line graph tells you exactly where reteaching needs to start.
Student Mistakes Worth Watching For Before You Grade
Most errors on graph interpretation tasks trace back to a small set of predictable misreadings, not weak arithmetic. The most common: students assume every mark on the y-axis equals 1. A bar reaching the third gridline on a scale that counts by fours represents 12, but a student who skips the axis label writes 3. That single habit — not reading the scale first — accounts for a disproportionate share of wrong answers on work that is otherwise procedurally solid.
On fractional line plots, a separate confusion surfaces. A student may count the X marks accurately above a particular point — three marks — but attach them to the wrong fractional value. If the marks sit above 1¼ and the student reads that as 1, every comparison and total that follows shifts. The error looks like a subtraction problem, but the root is misreading the fractional interval. On double bar and double line graphs, a third pattern shows up: students grab one bar from each data set without noticing that the question asks about a specific category. Asking students to underline the category name in the question before writing anything slows that particular mistake down considerably.
Standard Alignment
The clearest grade-level anchor for this set is 5.MD.B.2 in the Common Core State Standards for Mathematics, which expects fifth graders to make and use line plots displaying data measured in fractions of a unit and to solve problems using that information. That standard positions fractional line plot interpretation as a core Grade 5 target — not an extension — so worksheets that include fractional measurement tasks are addressing a documented expectation rather than pushing beyond the grade band.
In classroom terms, 5.MD.B.2 is the point where data interpretation and fraction reasoning intersect within the same task. The 5th grade interpreting graphs worksheets printable in this set treat those two demands — reading the display structure and reading the fractional values — as connected, because in actual student work they almost always fail together or succeed together. A student who stumbles on the fraction rarely misses only the fraction; the whole question unravels.
How to Build These Worksheets Into Your Lesson Plans
The set works best when the worksheet format matches what the lesson moment actually calls for. For a five-minute warm-up, one worksheet with three to four targeted questions gives students something to work through while the class settles, and reviewing answers takes less than two minutes. For independent practice after a mini-lesson on double bar graphs, pull a worksheet from that section and let students work through both the direct-reading and comparison items while the lesson content is still active. For small-group reteaching during station rotations — those focused 10-minute pulls — one fractional line plot worksheet narrows the session to exactly the format students are struggling with.
- Bell ringers and daily warm-ups: one worksheet with a short question set, discussed briefly before instruction begins
- Math centers: partner pairs share a worksheet and take turns explaining their reasoning aloud before recording answers
- Homework the night before a unit quiz: a mixed-format worksheet that revisits all the graph types covered that unit
- Sub plans: the resources work well unsupervised because each graph contains everything students need — no additional materials required
One classroom routine worth establishing early: before answering anything, students write the graph type, the title, and the scale interval at the top of the worksheet. It takes ninety seconds and cuts scale-skipping errors sharply. Over a unit it becomes automatic — which is the point, since assessments will not remind them to check.
Adjusting the Set for a Range of Learners
For students who struggle with the dual demand of reading the graph and performing the calculation, separating those two steps helps. Ask them to annotate the graph first — circling the relevant bars, marking scale values at key intervals, underlining the category named in the question — before writing any number. That annotation step reduces the working memory load and makes the source of an error more visible. If a student marks the right values but calculates incorrectly, the graph-reading is solid and the arithmetic is the problem. If the annotation itself is wrong, the misunderstanding is earlier and reteaching looks different.
For students who move through the standard items quickly, the comparison and explanation questions at the end of each worksheet provide natural extension. Push those students to write one additional question that could be answered from the same graph — then answer it themselves. That task requires scanning the display for relationships worth asking about, which is a more demanding analytical move than completing the assigned items and waiting.
Frequently Asked Questions
What graph types do these worksheets cover?
The set includes bar graphs, double bar graphs, line graphs, double line graphs, line plots with fractional measurements, and circle graphs. Each format is grouped within the set so teachers can pull by graph type depending on where instruction is focused at any given point in the unit.
Are these worksheets aligned with Grade 5 math standards?
The 5th grade interpreting graphs worksheets printable in this set align most directly with 5.MD.B.2, the Common Core standard that places fractional line plot work at Grade 5. The bar, line, and double graph worksheets reinforce the broader data reasoning expectations at this grade level, including the comparison and analysis tasks that appear in both classroom assessments and standardized testing.
Can these be used for homework, centers, or sub plans?
All three. Each worksheet is self-contained — the graph and the questions appear together — so students do not need additional materials or teacher support to complete the work independently. That makes the set practical for homework assignments, partner center work, and sub plans where the substitute may not be a math specialist.
How do the fractional line plot worksheets connect to fraction instruction?
The line plot worksheets use measurement scales marked in halves, fourths, and eighths, and ask students to calculate totals, find differences, and interpret frequency from those intervals. Teachers often time these worksheets to fall alongside fraction unit review rather than reserving them only for the data unit, since students benefit from seeing fractional quantities in more than one mathematical context during the same stretch of the year.