These 1st grade graphing data worksheets printable give teachers a ready-to-use collection covering tally marks, picture graphs, and bar graphs — the three representations first graders work with under CCSS.MATH.CONTENT.1.MD.C.4. Each worksheet isolates a distinct task within that standard, moving students from sorting and counting data through answering the comparison questions that most teachers know are the hardest part of this unit.
Five Skill Areas the Set Covers
The worksheets address five skill areas, each appearing in multiple formats so students build fluency rather than completing a task once and moving on.
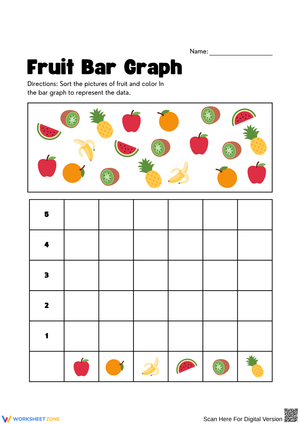
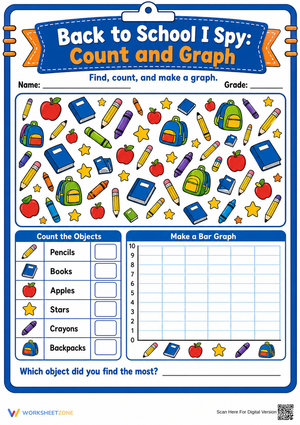
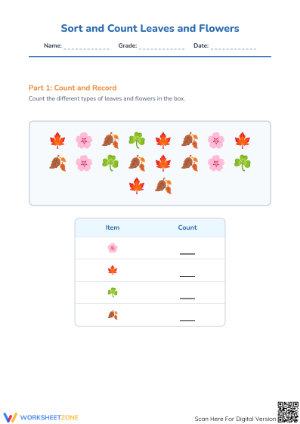
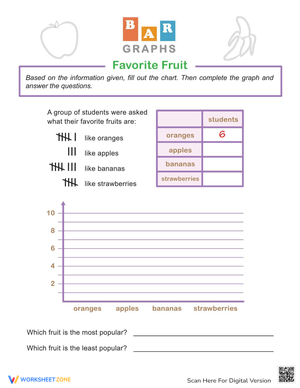
- Sorting and categorizing: Students group picture cards or classroom survey results into two or three labeled categories — enough variety to reveal meaningful differences, few enough to stay within first-grade working memory.
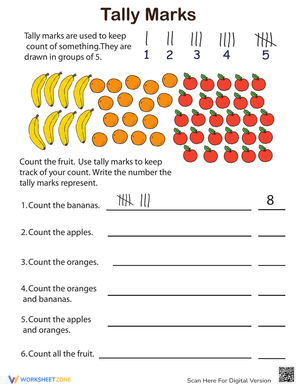
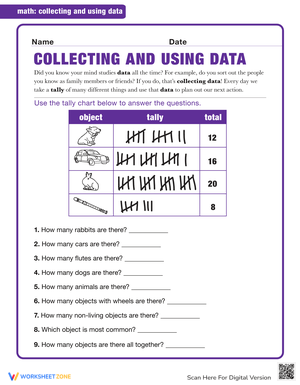
- Tally mark recording: Students bundle counts in groups of five, reinforcing one-to-one correspondence and laying early groundwork for skip counting.
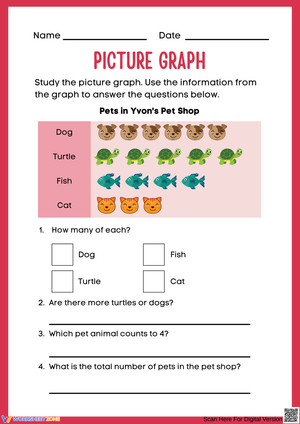
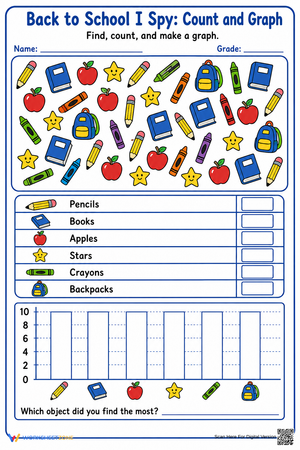
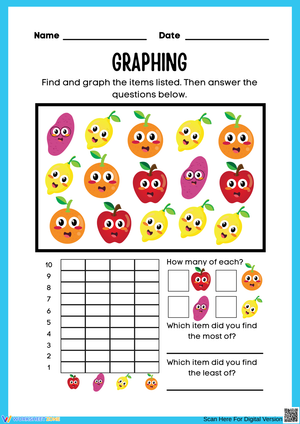
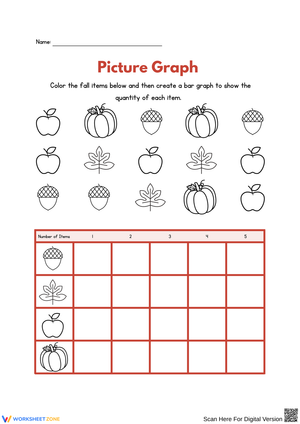
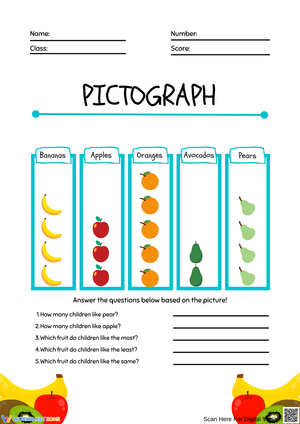
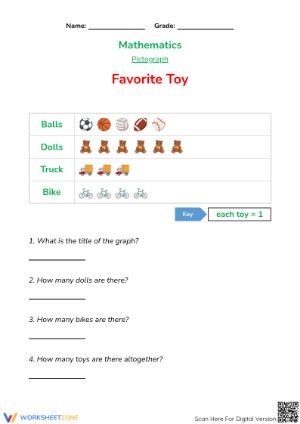
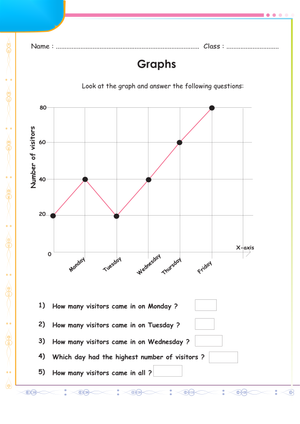
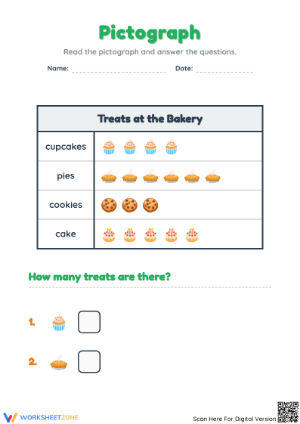
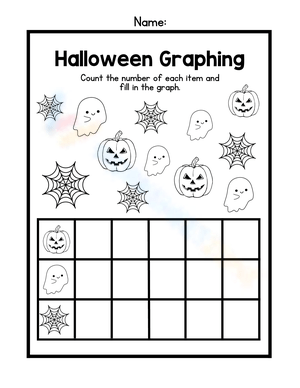
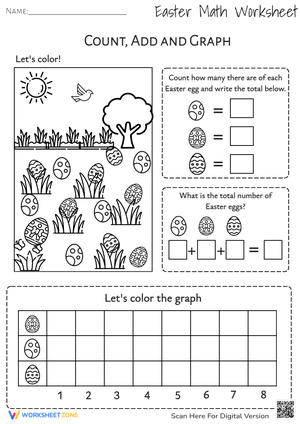
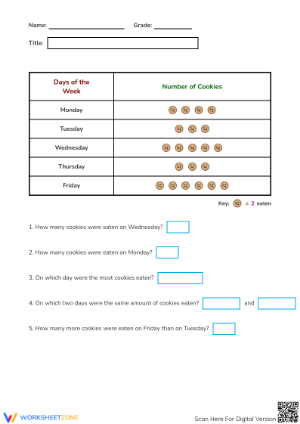
- Picture graph construction: Each symbol represents one data point; students draw or color images into rows or columns and then read totals back from the completed graph.
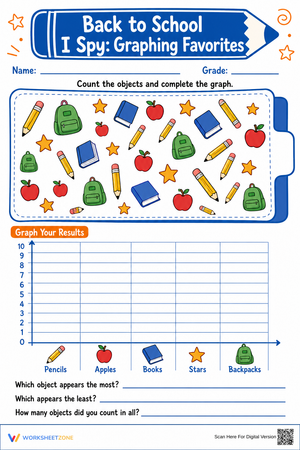
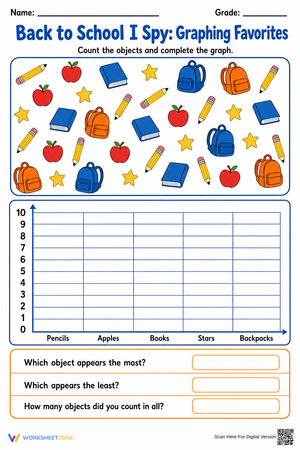
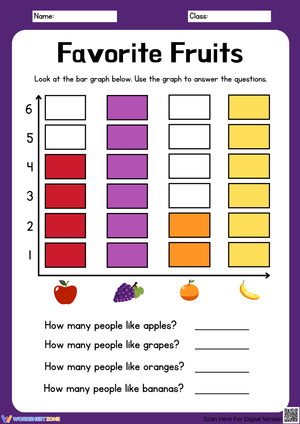
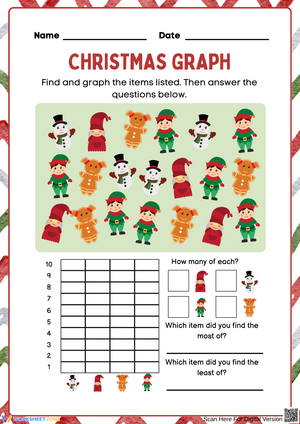
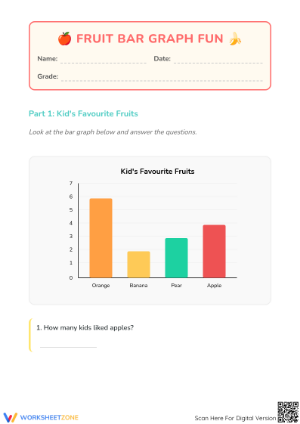
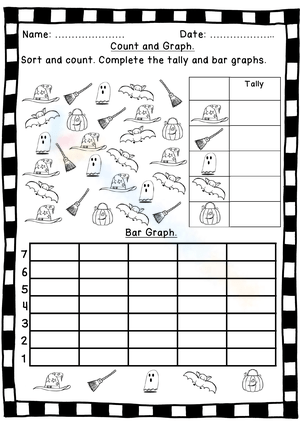
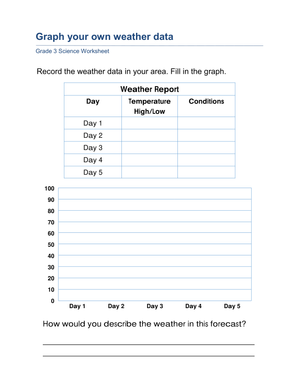
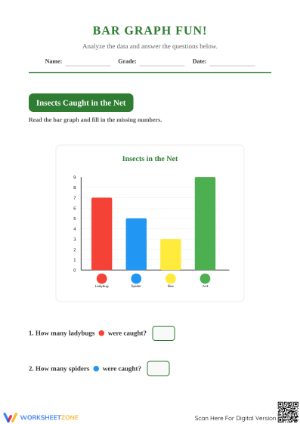
- Bar graph construction: Students color gridded bars to a given height, read values from labeled axes, and compare bar lengths — a more abstract representation than the pictograph, which is why it appears later in the sequence.
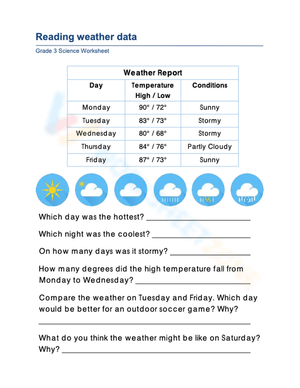
- Data interpretation: Every worksheet closes with questions that move from simple recall ("How many students chose red?") to genuine comparison ("How many more chose blue than green?"), which requires subtraction rather than reading a value directly off the graph.
As a set, the 1st grade graphing data worksheets printable move students through the concrete-to-representational-to-abstract arc: counting real objects, translating those counts into a visual graph, and then operating on that graph to answer reasoning questions.
Graphing Errors That First Graders Make Predictably — and How to Address Them
The most persistent tally error happens with the fifth mark. Students draw the diagonal line that completes a group of five but then count it as a separate mark, arriving at six instead of five. This shows up even in students who read a tally group correctly when it appears in isolation — the surrounding visual noise of a full worksheet triggers recounting from scratch. Spending two minutes at the document camera circling complete tally bundles before releasing students to work independently cuts this error faster than any re-explanation after the fact.
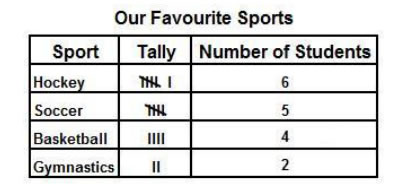
The subtler problem surfaces in comparison questions. A student who reads a bar graph accurately — dogs: 7, cats: 4 — will still write 11 as the answer to "how many more dogs than cats?" because "how many more" does not yet reliably trigger subtraction for most 6-year-olds. It is a semantic issue, not a graph-reading issue. Writing a sentence frame directly on the worksheet — Dogs have ___ more than cats because 7 − 4 = ___ — gives students the language structure to reason through the question without guessing the operation.
A third pattern worth catching early: when coloring bar graphs, students routinely stop at the line above the correct number rather than at the correct line itself. A student filling in a count of 4 colors to the boundary between 4 and 5. Asking students to place a fingertip on the target number on the axis before picking up their crayon catches this before the worksheet is finished.
Fitting These Worksheets Into the Week's Lesson Plan
The most effective placement is immediately after a live classroom data collection — not the next day and not as homework. A quick morning meeting survey ("Do you prefer apples, bananas, or oranges?") recorded on the board with tally marks takes about three minutes. The worksheet that mirrors that same structure goes out right after. Students are working with data they just created, which means they understand what the tally marks stand for in a way that a made-up data set on a standalone worksheet never quite achieves.
Use tally-to-graph worksheets for whole-class guided practice: read the tally chart together, then release students to build the bar graph independently. Read-the-graph worksheets — where the graph is already filled in and students only answer questions — function well as exit tickets because they assess interpretation under mild time pressure without requiring construction first. Save blank survey templates, which send students out to collect data from classmates, for later in the unit after the full recording-and-graphing cycle has been modeled several times in front of the whole class.
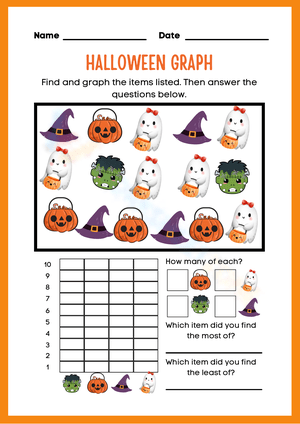
The 1st grade graphing data worksheets printable also hold up well during the 8 to 10 minutes before dismissal on Fridays, when students need structured work that does not require launching a new concept. A seasonal graph worksheet — a spring flower survey, a favorite-sport tally — keeps attention and consolidates the week's skills without feeling like a test.
Standard Alignment
These worksheets align to CCSS.MATH.CONTENT.1.MD.C.4: Organize, represent, and interpret data with up to three categories; ask and answer questions about the total number of data points, how many in each category, and how many more or fewer are in one category than in another.
This standard sits at the end of the Grade 1 Measurement and Data domain for a reason. The "how many more/fewer" questions require subtraction fluency within 20, and that fluency typically solidifies in the second half of the year. Teachers who introduce comparison graph questions in September — before students have genuinely internalized subtraction — consistently see students adding instead of subtracting because "how many more" sounds like numbers are being combined. Aligning the graphing unit with the back half of the year, once subtraction within 20 has received real instructional time, is the sequencing decision that makes this standard land the way it is supposed to.
Meeting Different Learner Needs With the Same Set of Worksheets
For students still working on number recognition and counting fluency, drop the comparison questions entirely and focus each session on one task: read the tally, then color the bar. Two categories instead of three also narrows the cognitive load considerably — many students who shut down when facing a three-bar graph manage a two-category comparison without difficulty, because the number of values to hold in mind drops from three to two.
The 1st grade graphing data worksheets printable support extension without requiring additional materials. Students who finish early can write their own question about the graph they built, then trade with a partner to answer it. That layer of oral and written production develops the precise vocabulary — "most," "fewest," "three more than" — that appears in standardized assessment items and in Grade 2 data work. English learners benefit from a brief preview of "more," "fewer," "most," and "least" before any worksheet is distributed; even a three-minute whole-class vocabulary review at the board makes the comparison questions accessible to students whose mathematical reasoning outpaces their academic English.
Frequently Asked Questions
Which representation should I introduce first — tally charts, picture graphs, or bar graphs?
Start with tally charts. They connect directly to counting, which students already know, and they give students a recording method before asking them to represent data visually. Picture graphs come next because each symbol maps one-to-one onto a real object, keeping the representation concrete and legible. Bar graphs are the most abstract of the three — a bar's height stands in for a quantity rather than picturing it — so they belong last in the instructional sequence.
How many categories should a first-grade graph have?
Two or three. CCSS.MATH.CONTENT.1.MD.C.4 caps the requirement at three categories because with four or more, the number of possible comparison questions multiplies and the cognitive demand shifts from data reasoning to managing a larger set of values simultaneously. Two categories work well for early practice and for students who need a reduced load; three categories are appropriate once students can consistently answer both "how many" and "how many more" questions on two-category graphs.
Do these worksheets work as homework?
They can, but comparison questions — "how many more," "how many fewer" — require students to interpret precise question language, and many first graders cannot navigate that independently without a teacher available to clarify. A worksheet sent home after whole-class guided practice is reasonable. A worksheet sent home as the first exposure to a new graph type tends to produce frustrated families and incorrect answers that have to be untaught the following morning.