These data and graphing worksheets pdf for 1st grade give teachers a sequenced set of standalone resources covering tally marks, pictographs, and bar graphs — each worksheet targeting a discrete skill in the order a well-built 1st grade unit actually teaches it. The set moves from data collection through representation and into interpretation, with comparative questions threaded throughout rather than saved for the end.
Skills Built Across the Set
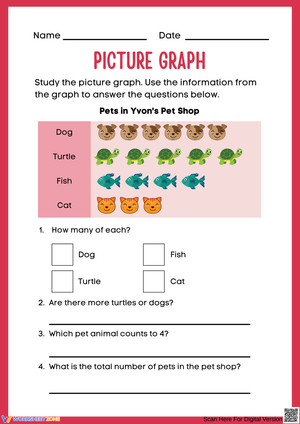
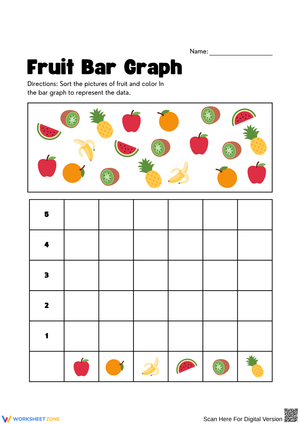
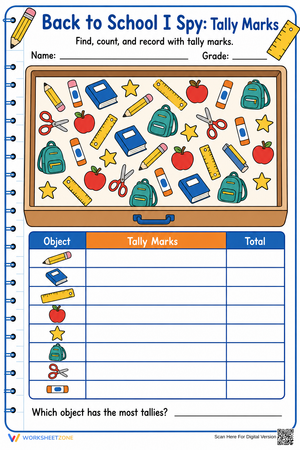
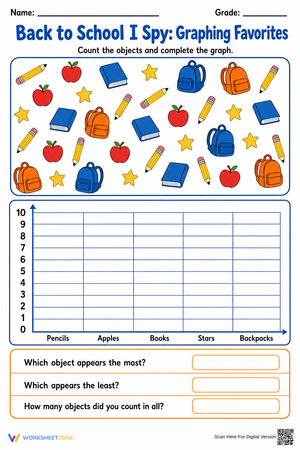
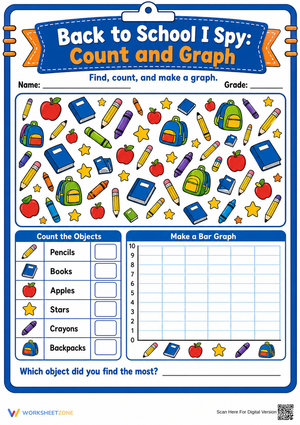
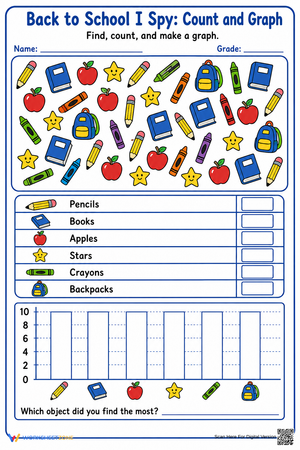
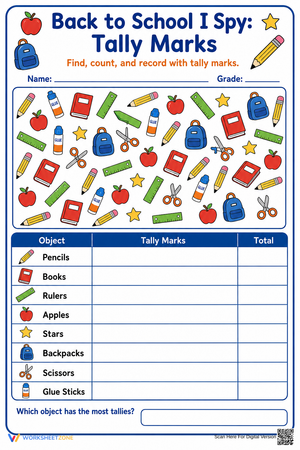
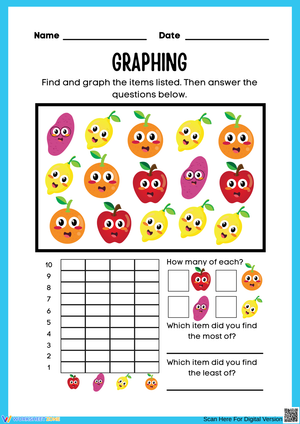
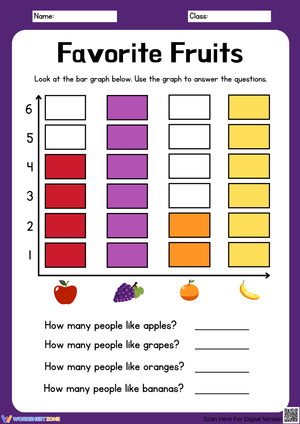
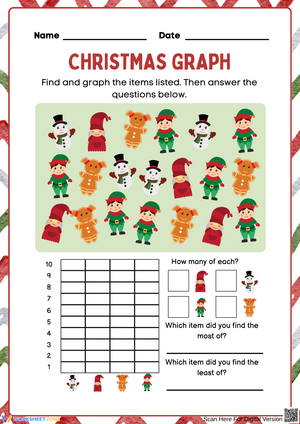
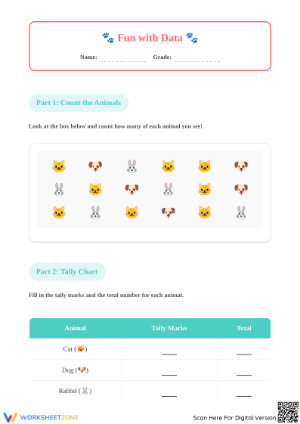
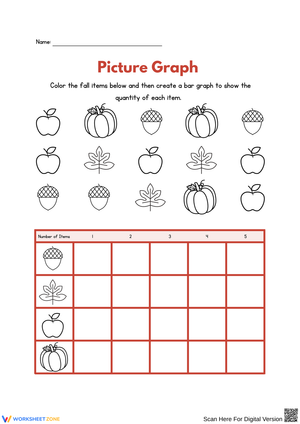
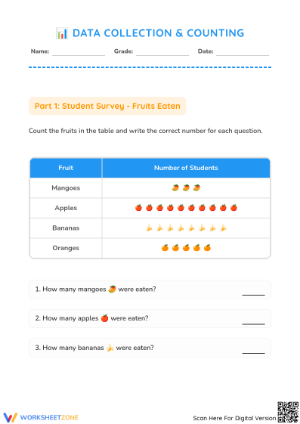
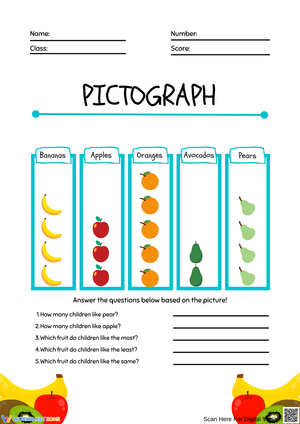
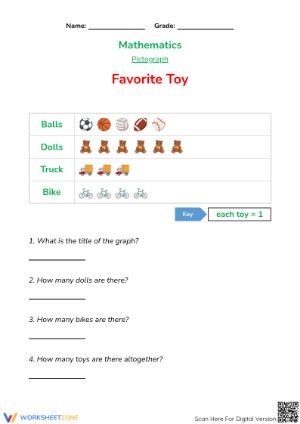
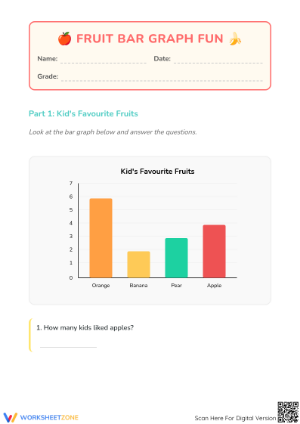
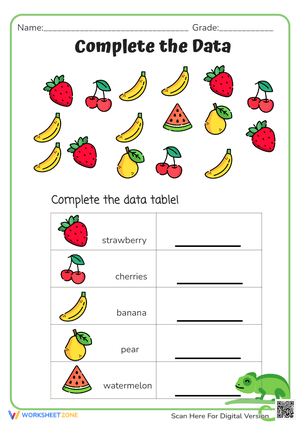
In the tally chart worksheets, students mark raw data using the standard grouping of five — four vertical strokes and one diagonal — and then count those groups to find category totals. This pairing of recording and counting is deliberate: tally marks directly support skip-counting by fives, so the graphing work and the number-sense work reinforce each other. In the pictograph worksheets, students read a one-to-one key, count symbols row by row, and write answers to questions about which category has more and which has fewer. In the bar graph worksheets, they both construct graphs from a given data table and read completed graphs to answer questions requiring addition and subtraction within 20.
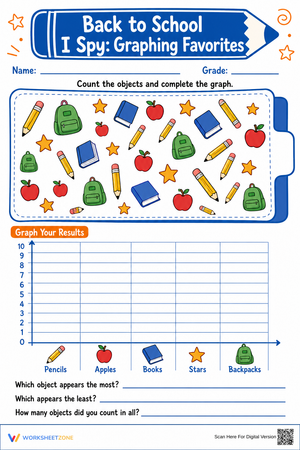
The interpretation questions on every worksheet ask students to name the category with the most entries, the category with the fewest, and the numerical difference between two categories. That last task — "how many more?" — is where the real cognitive work sits, and it connects directly to the subtraction facts students are developing at the same time. A student who can subtract 7 from 10 fluently still has to learn that a graph question is asking for subtraction; these worksheets make that connection explicit and repeated.
Student Mistakes Worth Catching Before They Harden Into Habits
The most persistent 1st grade graphing error isn't misreading the graph — it's answering "how many more?" by reading the taller bar's value rather than subtracting. A student looks at a bar graph showing 7 dogs and 4 cats, identifies the dogs bar as taller, and writes "7" as the answer to "how many more dogs than cats?" The taller bar's number is the most salient visual feature on the page, so it becomes the answer by default. This error stays invisible when the numbers are close — a bar at 2 versus a bar at 1 produces "1 more" by sight, which is correct — and then surfaces dramatically when the bars are further apart and estimation fails entirely.
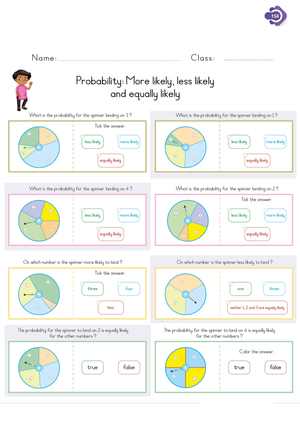
In pictograph work, a separate habit causes trouble: students count every symbol on the page before checking the key. When the key says one picture equals one item — as it does consistently throughout 1st grade — this produces correct answers. But the habit of skipping the key establishes itself quietly and at no cost, until it costs everything. Teaching students to circle the key before touching the data takes about ten seconds per worksheet and prevents confusion later if the scale ever shifts. Building that procedural step during 1st grade graphing work is far cheaper than remediation afterward.
Standard Alignment
CCSS.MATH.CONTENT.1.MD.C.4 directs 1st graders to organize, represent, and interpret data with up to three categories, answering questions about the total number of data points, how many are in each category, and how many more or fewer are in one category than another. Every worksheet in this set keeps data totals at or below 20 items, limits graphs to three categories, and includes at least one "how many more" or "how many fewer" question — the comparative question the standard explicitly names as a required skill.
What the standard doesn't spell out is the instructional timing it implies. Comparison questions require subtraction in context, which means data and graphing instruction runs most effectively when it overlaps with subtraction-within-20 work rather than preceding it. Teachers who sequence this data and graphing worksheets pdf for 1st grade set to run concurrently with their subtraction unit find that the two strands reinforce each other: the graph gives students a genuine reason to subtract, and the fact practice gives them the tool to answer the comparison question accurately.
Fitting These Worksheets Into Your Lesson-Planning Week
Tally chart worksheets work well as Monday warm-ups — they are short, procedurally familiar, and low-stakes, which lets students ease into math before the week's new instruction begins. Pictograph worksheets belong in the middle of a unit, during the 15-minute guided practice block when you are circulating and can catch errors before students repeat them. Bar graph worksheets, especially those with "how many more" questions, earn their place at the end of the week when a whole-class debrief can surface and correct the subtraction-versus-reading confusion before it calcifies.
During math center rotations, distribute the data and graphing worksheets pdf for 1st grade by matching cognitive demand to setting: tally work at the independent seat station, pictograph interpretation in the teacher-led group where you can intervene in real time, bar graph comparison as a partner task where students talk through their answers before writing them. That arrangement keeps the highest-demand skill paired with the most available support — without requiring additional materials or a separate lesson plan.
Adjusting the Set for a Range of First-Grade Learners
For students still developing number sense below 10, reduce the data before distributing a worksheet. A bar graph showing 8 total items in three categories is readable for a student who is not yet fluent with teen numbers; the same graph with 18 items is not. This is a pre-teaching modification, not a separate resource: cross out three or four data points on the original worksheet and adjust the question numbers accordingly before copying. The format stays identical, and the student works on the same skill.
For students who move through the core tasks quickly, extend the interpretation work rather than switching to a different worksheet. Ask them to write a new question about the same graph, answer it, and explain how they solved it. This pushes toward 1st grade mathematical writing and verbal reasoning without requiring a different visual format or a more complex data set — and it keeps fast finishers engaged with the same material the rest of the class is still processing.
Students who struggle with the fine motor demands of tally marks — the four-vertical-and-one-diagonal stroke is genuinely difficult for some 6-year-olds — benefit from using dot stickers to record data before transferring to the printed format. The counting and grouping work stays fully intact; only the recording tool changes. Once the concept is solid, the motor skill catches up with practice.
Frequently Asked Questions
Why do students build the bar graph correctly but then misread it when answering questions?
Building a bar graph and reading one are separate cognitive tasks, and 1st graders often treat them as unrelated. During construction, students focus on motor accuracy — color up to the 5, stop there. During the question phase, they look at the finished graph as a new object and re-count from scratch, often starting from the top of a bar downward instead of from the baseline upward, which produces miscounts. One reliable correction: after students finish coloring, have them trace a finger from the top of each bar straight down to the axis number and say that number aloud before reading any questions. This re-anchors each bar's value before interpretation begins and takes under a minute.
How many worksheets from this set fit into a standard two-week graphing unit?
A two-week 1st grade graphing unit typically includes four to six direct instruction lessons and a comparable number of practice sessions. Plan on one worksheet per practice session — roughly five or six worksheets total, mixing tally, pictograph, and bar graph formats across the two weeks. The data and graphing worksheets pdf for 1st grade set provides enough variety to avoid repetition across those sessions while keeping the skill focus consistent, so students return to the same core vocabulary and question types rather than encountering a new format every day.
Are the pictograph worksheets appropriate for kindergarteners who are ahead in math?
Kindergarteners who are fluent counters within 10 and have already worked with sorting and classifying can handle the pictograph worksheets — the one-to-one key is intuitive when counting is already solid. The tally mark worksheets are not appropriate for most kindergarteners, because grouping by fives requires number sense that typically develops in 1st grade. The bar graph worksheets, particularly those with "how many more" comparison questions built around subtraction, are firmly 1st grade material and belong there.