Tally charts pdf worksheets for 1st grade give teachers a direct line from whole-class data collection to independent student recording — printed pages where a child marks each vote with a stroke, groups four-plus-one into five, and arrives at a total that matches what the class actually counted. The five-group convention is the pivot point of this whole skill, and these worksheets make that structure visible at every step. Teachers working through a data and graphing unit find that these pages move the lesson from floor demonstration to independent practice with minimal transition time.
What Each Worksheet Builds
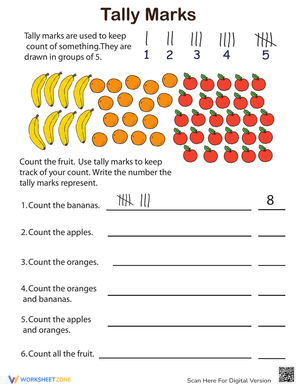
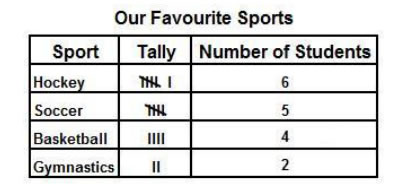
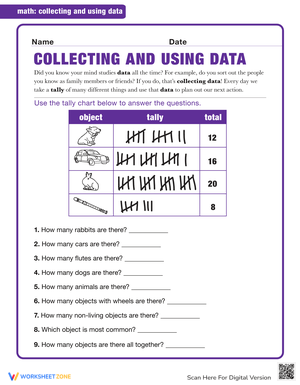
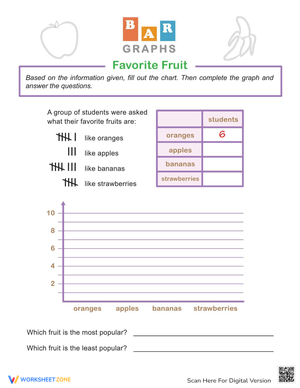
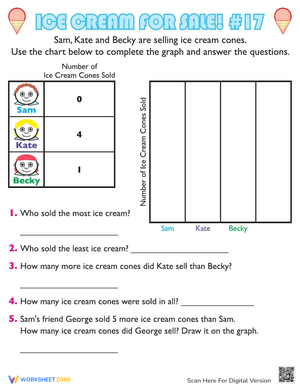
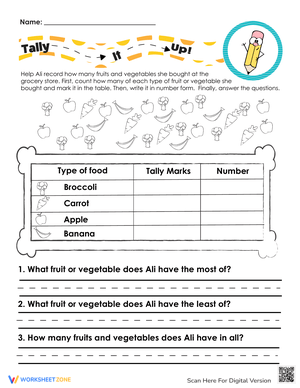
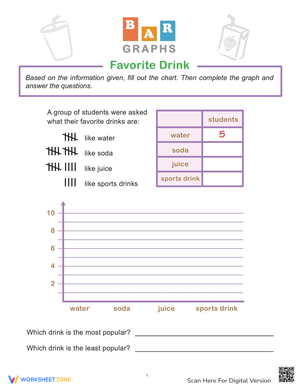
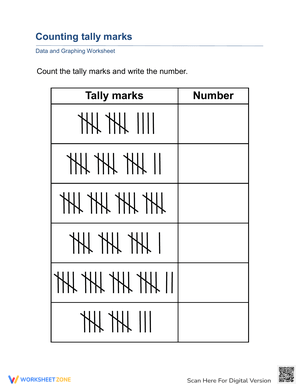
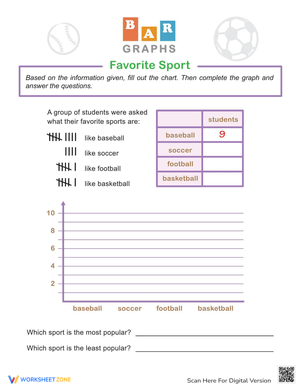
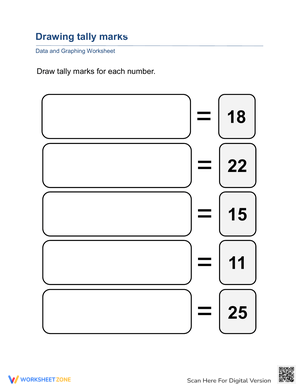
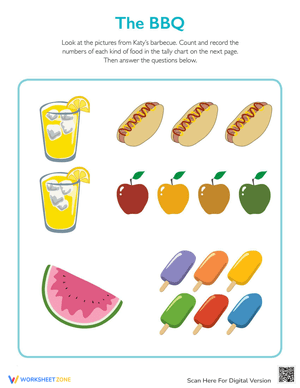
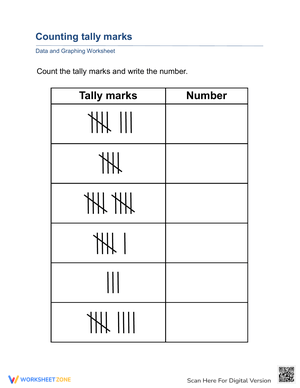
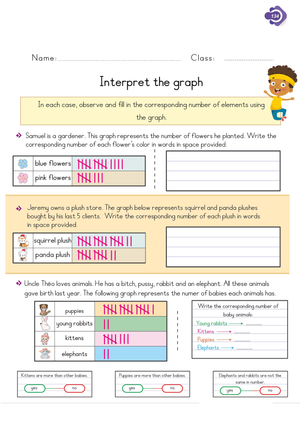
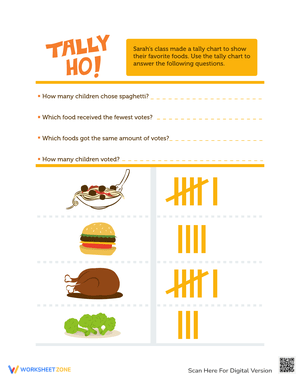
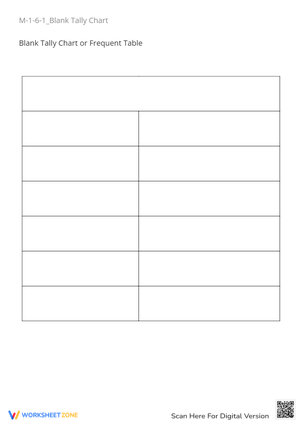
The skill sequence in this set runs three layers deep. The first layer is the mark itself: four vertical strokes, then a diagonal fifth. That convention is not obvious to a child who has only counted objects one at a time, and students need to see it modeled before they try it independently. The second layer is reading completed charts — identifying category totals, comparing groups, and interpreting prompts like which has the most and how many more than. The third layer is producing tally records from raw data, which means a student looks at a picture set or listens to survey results and builds the chart from scratch.
The comparison language woven into these worksheets matters beyond data. Students who answer "how many more" questions on a tally chart are practicing the same subtraction reasoning they need in operations. The familiar context makes the math feel purposeful rather than procedural.
Errors That Show Up in Student Work — and What They Signal
The most common mistake at this level is not misreading the marks — it is drawing them wrong in the first place. A student who writes five separate vertical lines instead of four-plus-a-diagonal has missed the grouping logic entirely. The problem is structural, not arithmetic. A quick model with five counters and a marker, where you physically place each counter while drawing each stroke and then add the fifth while drawing the diagonal, usually resolves this faster than assigning more problems.
A second pattern: students who count each tally mark individually rather than counting the groups by fives. If a chart shows four completed groups plus two extra marks, these students count 22 separate strokes rather than saying 20 and 2. This signals that five-group bundling has not transferred yet. Pointing to each bundle and asking "how many is this one?" before counting on tends to break the habit within a session or two.
The third error is more subtle. Some first graders answer comparison questions — "how many more votes did cats get than dogs?" — by restating the larger total rather than finding the difference. They write "7" instead of "3" because they are answering the question they recognize, not the one that was asked. This is a reading-comprehension gap as much as a math gap, and it shows up consistently enough in student work that it is worth flagging in small-group lessons before moving on.
Building These Worksheets Into Your Lesson Week
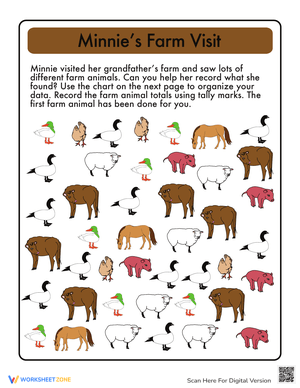
Tally charts pdf worksheets for 1st grade slot naturally into the gradual release sequence. The most effective approach starts with a live data collection — a quick class vote on a familiar topic (recess game preference, favorite classroom read-aloud character, lunch choice) where one student draws tally marks on the board as classmates raise hands. Then the printed worksheet becomes practice, not introduction: students already understand what the marks mean because they just made them. No additional materials are required beyond the page itself.
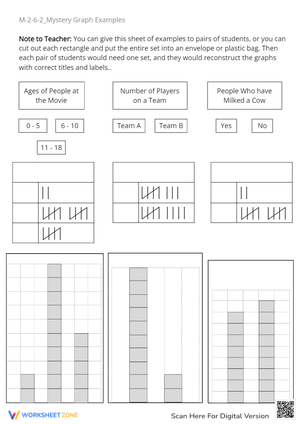
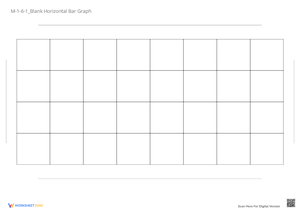
In a center rotation, one station can ask students to read a pre-filled chart and answer comparison questions; a second station can ask them to record marks from a picture set; a third can have them transfer tally totals to a simple picture graph. All three can run off the same batch of printed pages. For the eight minutes before afternoon pickup or the tail end of a math block with unexpected time left, these worksheets also function as reliable independent work — self-contained enough that students can proceed without re-explanation.
Standard Alignment
These worksheets address CCSS.MATH.CONTENT.1.MD.C.4, which asks first graders to organize, represent, and interpret data with up to three categories and to answer comparison questions about totals. In instructional terms, this standard appears after students have worked with counting and cardinality in kindergarten and before the more complex graphing representations expected in second grade. Tally charts sit at the front of this standard's arc: students first use marks to organize data, then interpret what those marks show, then compare results — the same three-stage sequence these worksheets follow.
Adjusting These Worksheets for a Range of Student Readiness Levels
For students who need more support, restrict the chart to two categories and keep totals under ten. Having counters available to match one-to-one against each tally mark before counting groups helps students who are not yet reading the five-bundle automatically. Some students benefit from a partially completed chart — a few marks already drawn — so they are adding to a structure rather than starting from a blank row.
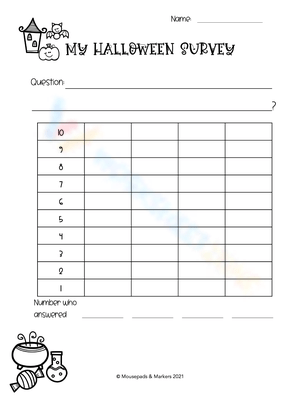
On-level practice includes three categories, mixed totals up to twenty, and comparison questions with one step. Students who are ready for a greater challenge can collect their own data from classmates, label their own category columns, and then transfer results to a picture graph on a second worksheet. Asking these students to write one sentence describing what their data shows moves the work into early mathematical communication — a skill that appears formally in later grades but develops well in low-stakes tasks like this one.
One honest limitation worth naming: tally charts pdf worksheets for 1st grade in a fixed format can frustrate students who freeze when the context shifts. A child who practiced weather tallies for two weeks may hesitate in front of a chart about favorite sports — not because the math changed, but because the topic is unfamiliar. Rotating contexts deliberately across the set (pets, food, classroom objects, outdoor observations) builds the flexibility that prevents that hesitation.
Frequently Asked Questions
What should students already know before working with these worksheets independently?
Students need to count objects accurately to at least twenty, understand that a mark stands for one item or vote, and have some experience sorting objects into categories. If they have never worked with groups of five in any context, a brief hands-on lesson with cubes or counters organized into five-groups is worth doing before the first worksheet.
How do I correct a student who keeps drawing five separate vertical strokes?
Model the structure physically before any written practice. Draw four strokes while counting aloud, then pause — "watch what happens to number five" — and draw the diagonal. Have students air-draw the sequence several times before touching pencil to paper. Kinesthetic repetition cements the pattern faster than written correction on a finished worksheet.
Can these worksheets replace live data-collection activities?
No, and teachers should not expect them to. A worksheet provides practice with a skill students have already seen. If a child has never watched real data get recorded as tally marks, the printed page gives them marks without meaning. These worksheets are most effective after at least one whole-class experience where students watch information get collected and recorded in real time.
In what order should I assign worksheets across the unit?
Move from reading to recording to comparing. Let students interpret completed charts first — they answer questions about marks already drawn. Then ask them to add marks to partially built charts. Then give blank charts with data provided as pictures or a list. Tally charts pdf worksheets for 1st grade sequenced this way build the skill progressively without leaving students stranded on their first independent attempt.