These pictographs worksheets for 1st grade close the gap between a class sorting activity and a student working independently on a graph. Each worksheet uses a one-to-one key, familiar category topics, and tasks that move from reading a completed graph to building one from class data. The result is a concrete transition tool for the moment in a data unit when the concept has clicked but the written work hasn't caught up yet.
What Each Worksheet Asks Students to Do
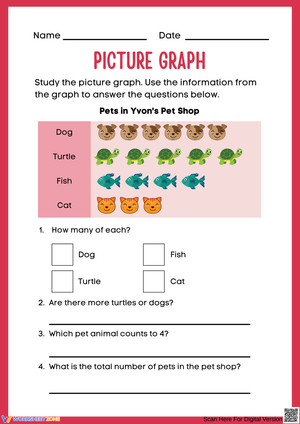
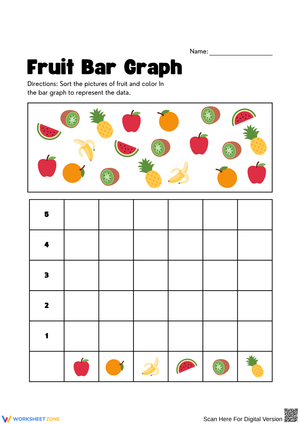
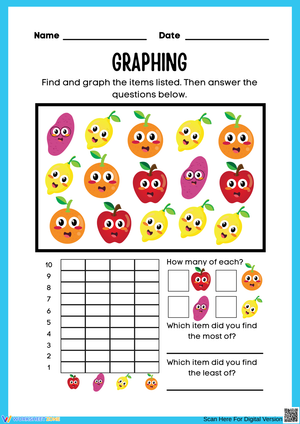
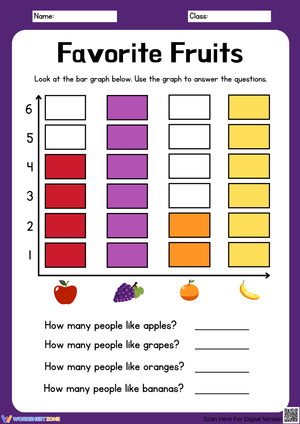
The pictographs worksheets for 1st grade in this set cover the core skills a Grade 1 data unit requires. Each task falls into one of three categories: reading a completed graph, building a graph from given data, or answering comparison questions based on what the graph shows. That range matters because reading and building are different cognitive tasks — a student who answers "which has most?" correctly on a finished graph often still needs a separate experience placing pictures to understand why one row ends up longer than another.
Across the set, students work through these specific operations:
- Counting pictures in each category row and recording totals
- Matching category labels to the data rows they identify
- Applying a one-to-one key to verify picture counts
- Using comparison terms — more, fewer, most, least — in written answers
- Placing or circling pre-printed icons to build a graph from supplied data
The comparison vocabulary work is deliberately heavy because those terms appear in the standard's exact wording and are the last piece students tend to internalize. Students often count the pictures correctly and still write "more" when they mean "most" — not because they misread the graph, but because the distinction between a pairwise comparison and an across-all-categories comparison hasn't fully settled yet.
Reading Errors First Graders Make — and What These Worksheets Surface
The most consistent error in early picture graph work is visual: students identify "most" by pointing to the longest row rather than counting the pictures in it. A student who counts five items correctly on a separate counting task will still circle the category whose pictures stretch farthest across the page — especially if one icon is slightly larger or the spacing between pictures is uneven. These worksheets use consistent icon sizing and even spacing precisely because inconsistency invites that error.
A second pattern shows up just as reliably: students answer comparison questions by re-reading the last row they counted, not the row the question actually named. If "dogs" is the third row down and a student's finger is resting near the fourth, the number written belongs to the wrong category. A reliable fix is to teach students to touch each picture as they count, then slide a finger back to the category label before writing. That fifteen-second routine catches most of those errors before they become recorded answers.
One more error worth addressing in instruction before any independent work begins: students who see a key illustration labeled "= 1" sometimes count the key picture itself as a data point. Pointing to the key and saying "this picture is the rule, not the data" once during whole-group modeling is worth the thirty seconds it takes.
Where These Worksheets Fit Best in Your Lesson Sequence
The pictographs worksheets for 1st grade in this set do their best work the day after a concrete data activity. Run a quick class survey — favorite fruit, preferred read-aloud animal, how students got to school — and represent the results with sticky notes or grouped objects on the whiteboard. Once students have physically touched and counted actual categories, a worksheet that mirrors that same structure gives them familiar footing. They are not learning the concept and the format at the same time.
During small-group reteach, the graph-building worksheets are especially effective. Students who seem confused by a completed graph often clarify their own thinking by placing pictures themselves. Four students building the same graph from the same data and then comparing their results will surface more confusion in ten minutes than answering questions on a finished graph ever would.
For independent practice, the reading-and-answer worksheets fit cleanly into Monday morning warm-ups or the last eight minutes before a transition. The format is self-contained, students recognize the routine from whole-group instruction, and the work is quiet enough that a teacher can pull a small group while the rest of the class works through the page.
Standard Alignment
These worksheets address CCSS 1.MD.C.4, which requires first graders to organize, represent, and interpret data with up to three categories, and to answer questions about total data points, individual category counts, and how many more or fewer items one category has compared to another. The standard sits at Grade 1 because students are ready to attach numerical meaning to a visual display without needing multi-step operations. Every comparison task in this set stays within subtraction facts to 10, and no key requires multiplication or skip counting.
Tuning the Work for Different Entry Points in the Room
These pictographs worksheets for 1st grade include adjustment points that don't require building entirely separate materials. Students who need more support work best with the two-category worksheets, where the comparison question involves only two rows. Pre-counting icons together — placing a counter chip on each picture as it's counted — separates the counting task from the interpretation task and keeps the session moving before reasoning comes to a halt.
Students ready for more can finish a graph-building worksheet and then work through follow-up questions that go beyond the page: What would the graph show if two more students chose oranges? or Which category would disappear entirely if everyone who chose dogs switched to cats? These questions ask students to hold the graph structure in mind while reasoning about a change — exactly the thinking that carries into second grade data work.
For students still developing fine motor control, tracing or circling pre-printed icons rather than drawing their own is a straightforward option. It keeps the interpretive and comparison tasks intact and removes an obstacle that has nothing to do with reading data.
Frequently Asked Questions
What standard do these worksheets address?
CCSS 1.MD.C.4. Students organize and represent data with up to three categories and answer questions about total counts, individual category totals, and the difference between categories. The standard's specific phrase "how many more or less" explains why comparison questions are built into every worksheet in the set.
How many categories work best for a Grade 1 picture graph?
Two to four. Two categories work well for students who are just beginning and need the comparison to be unambiguous. Three or four categories match the scope of 1.MD.C.4 and add enough complexity for students who understand the structure but need more comparison practice to consolidate the vocabulary.
Do students need to draw pictures to complete these worksheets?
No. Every worksheet uses pre-printed icons. On reading worksheets, students mark or count existing pictures. On building worksheets, they place or circle icons from a printed bank — drawing ability is not required to demonstrate data reasoning, and the format keeps the focus where it belongs.