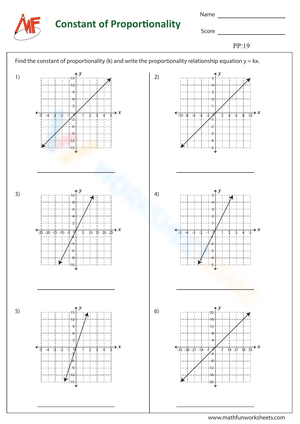
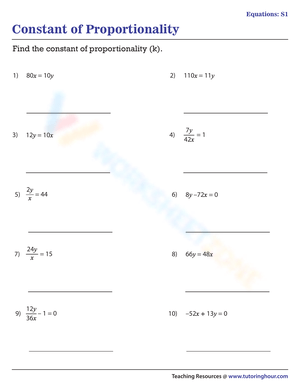
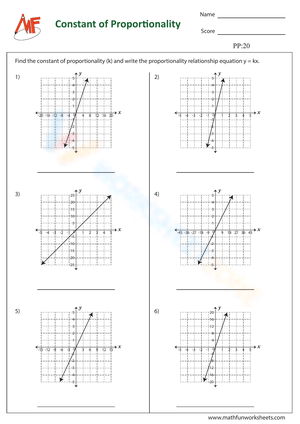
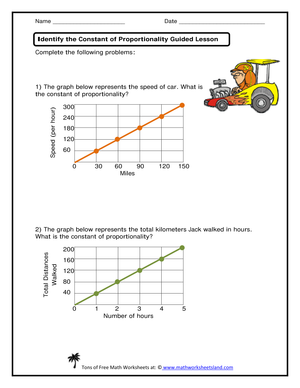
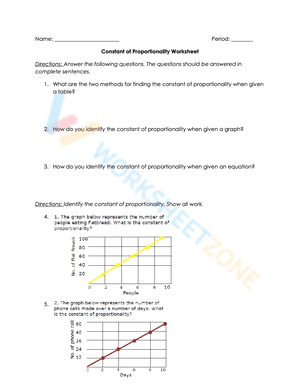
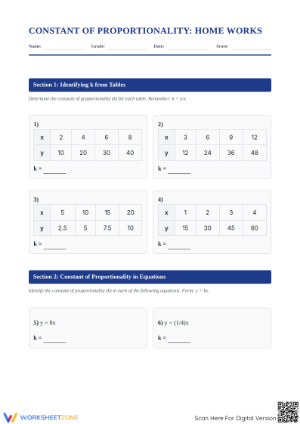
What constant of proportionality worksheets teach
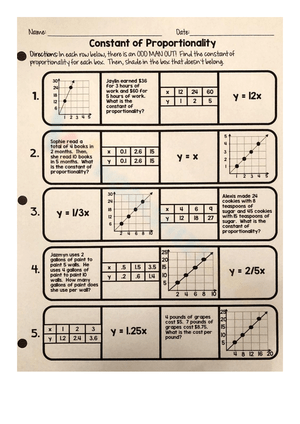
Constant of proportionality worksheets give Grade 7 students repeated practice finding the value of k in the equation y = kx. That single number, the unit rate that links two proportional quantities, shows up in tables, graphs, equations, and word problems. Worksheets that rotate through all four forms help students see that k stays the same no matter how the relationship is displayed. For teachers, a strong set means less time drawing examples on the board and more time watching how students reason about equivalent ratios.
This page walks through how to pick and sequence these worksheets so they match what your standards actually ask, where students tend to stumble, and how to turn a stack of practice pages into quick formative data.
Because the same k threads through every representation, one worksheet set can carry a full week of instruction. That consistency is what makes the topic worth investing in: master it in Grade 7 and students walk into slope and linear functions in Grade 8 already fluent in the underlying idea.
How the worksheets support the three sub-skills of 7.RP.A.2
Under CCSS 7.RP.A.2, identifying the constant of proportionality is not one skill but three connected moves. Worksheets work best when they hit each one on purpose.
- Deciding whether a relationship is proportional (7.RP.A.2.a): students test equivalent ratios in a table or check whether a graph is a straight line through the origin.
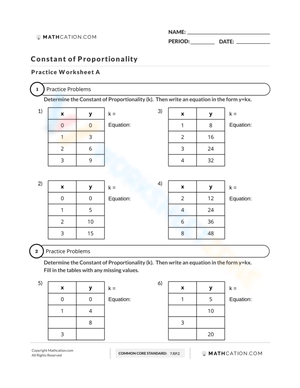
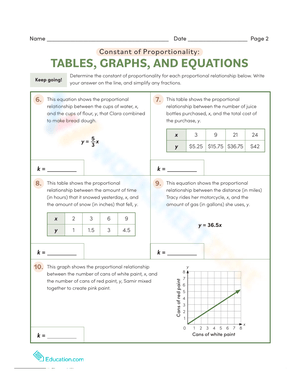
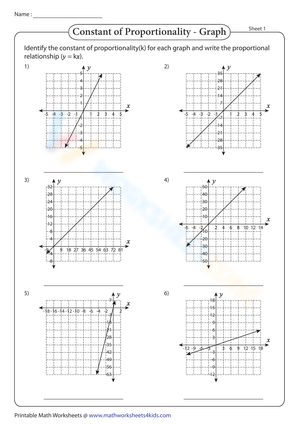
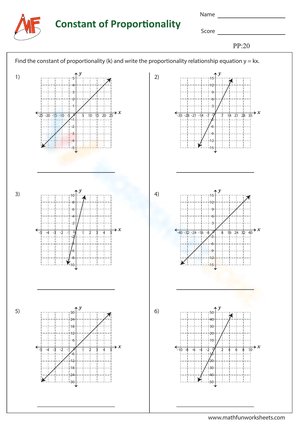
- Identifying k (7.RP.A.2.b): students pull the constant of proportionality out of tables, graphs, equations, diagrams, and verbal descriptions.
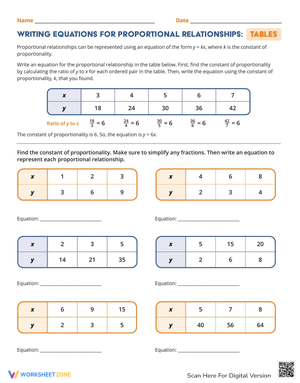
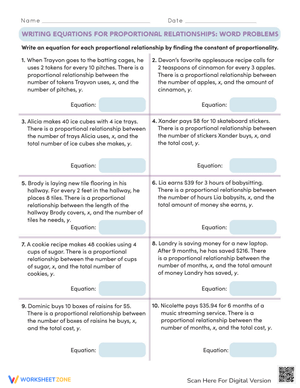
- Writing the equation (7.RP.A.2.c): students express the relationship as y = kx, such as t = pn for total cost at a constant price per item.
Choosing worksheets that name which sub-skill they target keeps your practice aligned and makes it easier to spot the exact point where a student loses the thread. A simple label in the corner, 2.a, 2.b, or 2.c, lets you build a balanced packet and hand a student exactly the sub-skill they still need.
Tables, graphs, and equations: one k in three forms
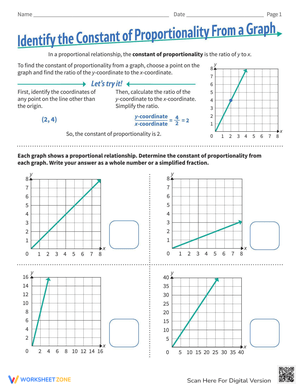
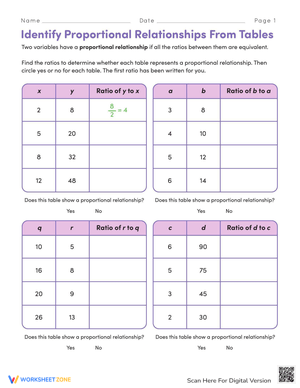
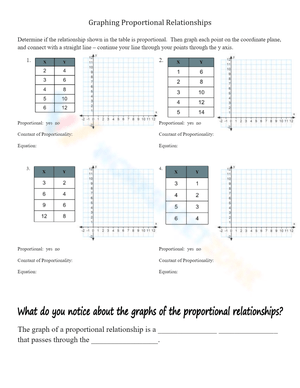
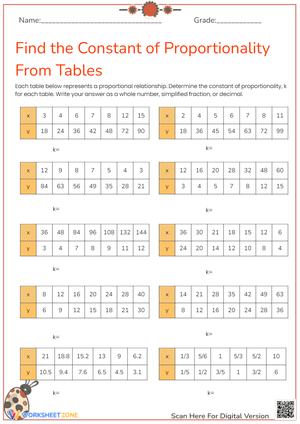
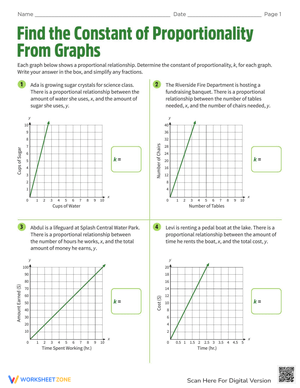
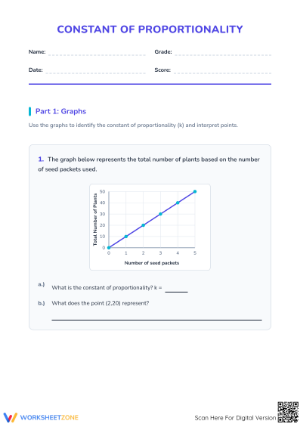
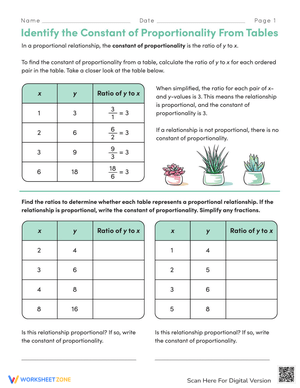
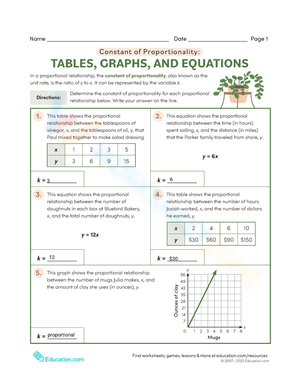
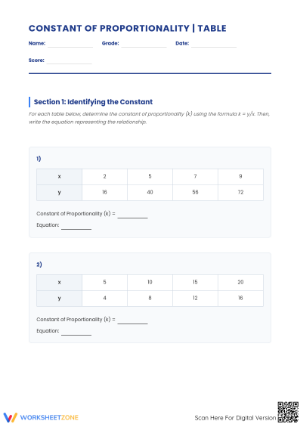
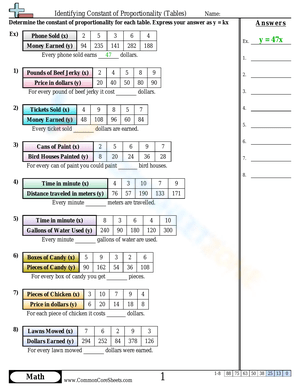
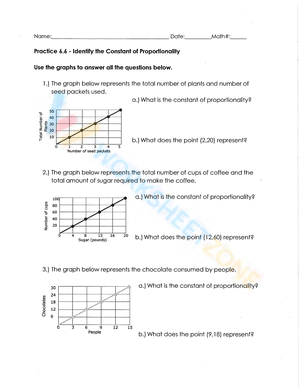
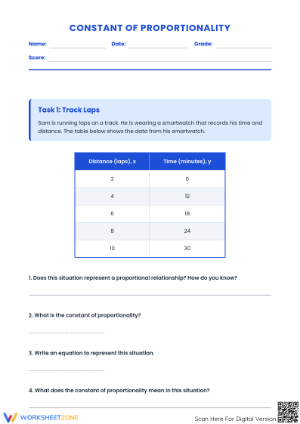
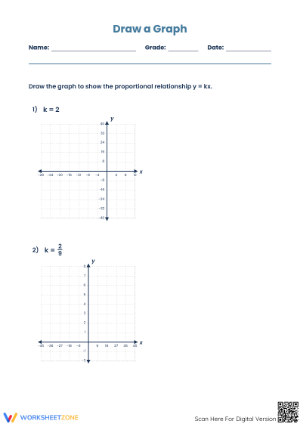
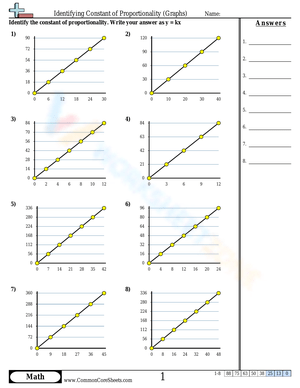
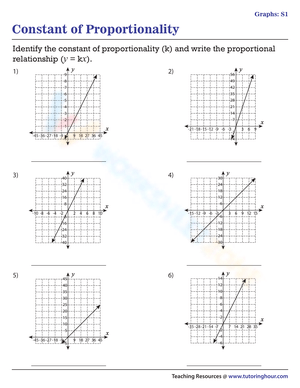
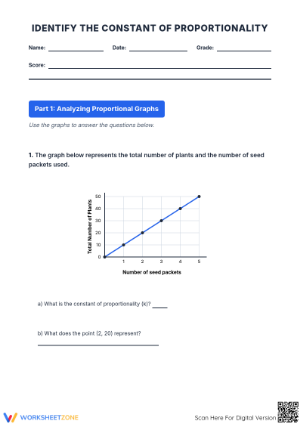
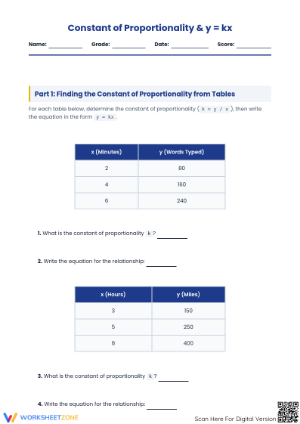
The move that separates fluent students from struggling ones is recognizing that k = y ÷ x works the same way in every representation. In a table, students divide any y-value by its paired x-value and should get the same quotient down the column. On a graph, k is the y-value where x equals 1, so a worksheet that asks students to mark the point (1, k) turns an abstract constant into something they can literally point at. In an equation already written as y = kx, k is simply the coefficient. When one worksheet page shows the same relationship as a table, a graph, and an equation side by side, students stop treating them as three unrelated problems and start treating k as the fingerprint of the relationship. Worksheets that force this cross-checking, find k here, then confirm it there, build exactly the flexibility the standard is after.
Common misconceptions these worksheets expose
The most frequent mix-up is confusing the constant of proportionality with slope or with a rate of change that carries units. Students who have only seen k as the number in front of x often freeze when a relationship arrives as a table or a description. Others test a single pair of values, find one ratio, and assume the whole relationship is proportional without checking a second pair.
Worksheets that deliberately include non-proportional relationships, lines that miss the origin, and tables with a hidden constant added to each term are the ones that catch these errors. When a student confidently writes a k for a relationship that is not proportional at all, you have found a teaching moment that a page of clean, always-proportional examples would have hidden.
Build a short answer key habit around these traps. When you review a mixed worksheet as a class, ask students not just for the value of k but for the evidence that the relationship earned a k at all. That single question, how do you know it is proportional, does more to cement the standard than a dozen routine calculations.
What the standards actually require
Before buying or building a set, it helps to anchor practice to the exact language of the standard.
According to the Common Core State Standards Initiative, standard 7.RP.A.2.b asks Grade 7 students to identify the constant of proportionality in tables, graphs, equations, diagrams, and verbal descriptions, spanning five representations in one sub-standard. That range is why worksheet variety across formats matters more than sheer problem count.
Keep that five-representation demand visible when you plan. If your worksheet stack only ever shows equations, students will meet a table on the state test and treat it as a brand-new problem. Coverage across all five forms is the difference between recognition and true fluency.
Classroom Implementation
Open with a short unit rate review so the leap to formal notation feels small. Ask students to find the price per item or the miles per hour first, then show that this familiar number is exactly the k in y = kx. That connection turns new vocabulary into a relabeling of something they already know.
From there, use worksheets in a predictable rotation: one day on tables, one on graphs, one on equations, and one mixed day where students identify the form before solving. Keep the same context, say bagels per dozen or cost per gallon, across the week so the numbers change but the reasoning stays visible.
Collect one worksheet mid-week as a quick formative check. Sort the pages into three piles: students who found k every time, students who found it in some forms but not others, and students who tested only one ratio. Those piles become your small groups for the next session without any extra planning. Reusing the same worksheet template each week means students spend their energy on reasoning, not on decoding a new layout.
Differentiating for intervention and enrichment
For intervention groups, choose worksheets with smaller whole-number ratios and pre-drawn tables so students focus on the division that produces k rather than on setup. Illustrative Mathematics tasks aligned to 7.RP.A.2 offer contexts you can simplify further, cutting the number of steps while keeping the reasoning intact.
For enrichment, hand students multi-step word problems where they build the table themselves, spot a non-proportional trap, or compare two proportional relationships and decide which has the larger k. Asking a student to write their own proportional and non-proportional scenario, then trade with a partner to test, pushes the skill past recognition into construction.
Pairing intervention and enrichment on the same context also lets you run the groups side by side. While one group finds k in a pre-filled table of ticket prices, another writes an equation for the same tickets and predicts the cost of twenty. Same worksheet theme, two levels of demand, one manageable lesson.
Frequently Asked Questions
1. What grade level covers the constant of proportionality?
In US classrooms it lands in Grade 7, under the ratios and proportional relationships standards. Students usually meet it after a review of unit rate and just before formal work on graphing proportional relationships and, later, slope in Grade 8.
2. How is the constant of proportionality different from a unit rate or slope?
The constant of proportionality is the unit rate written as a pure number k in y = kx. It matches slope numerically for a line through the origin, but slope is a broader idea that also applies to lines that do not pass through the origin, where no single constant of proportionality exists.
3. What is an effective way to check if a relationship is proportional on a worksheet?
Have students test at least two pairs of values for equal ratios in a table, or check whether a graph is a straight line passing through the origin. If either test fails, the relationship is not proportional and has no constant of proportionality.
4. How can teachers use these worksheets for small-group intervention?
Use a completed worksheet as a sorting tool. Group students by the specific representation they miss, tables, graphs, or equations, and reteach that form directly instead of repeating the whole unit.
5. What real-world contexts work best for word problems?
Constant-price shopping, distance at steady speed, recipe scaling, and hourly pay all produce clean proportional relationships students can picture. These contexts make the constant of proportionality feel like a real rate, price per item or miles per hour, rather than an abstract letter.













 Interactive Worksheet Maker
 Quiz Maker
 Word Search Maker
 Crossword Puzzle Maker
 Word Scramble Generator
 Sentence Scramble Generator
 Handwriting Worksheet Generator
 Name Tracing Generator
 Fill In The Blank Generator