


1 / 5
0
Views
0
Downloads

0.0
0
Save
0 Likes
Understand Constant of Proportionality with this Worksheet
0 Views
0 Downloads
Paste this activity's link or code into your existing LMS (Google Classroom, Canvas, Teams, Schoology, Moodle, etc.).
Students can open and work on the activity right away, with no student login required.
You'll still be able to track student progress and results from your teacher account.
Information
Description
What It Is:
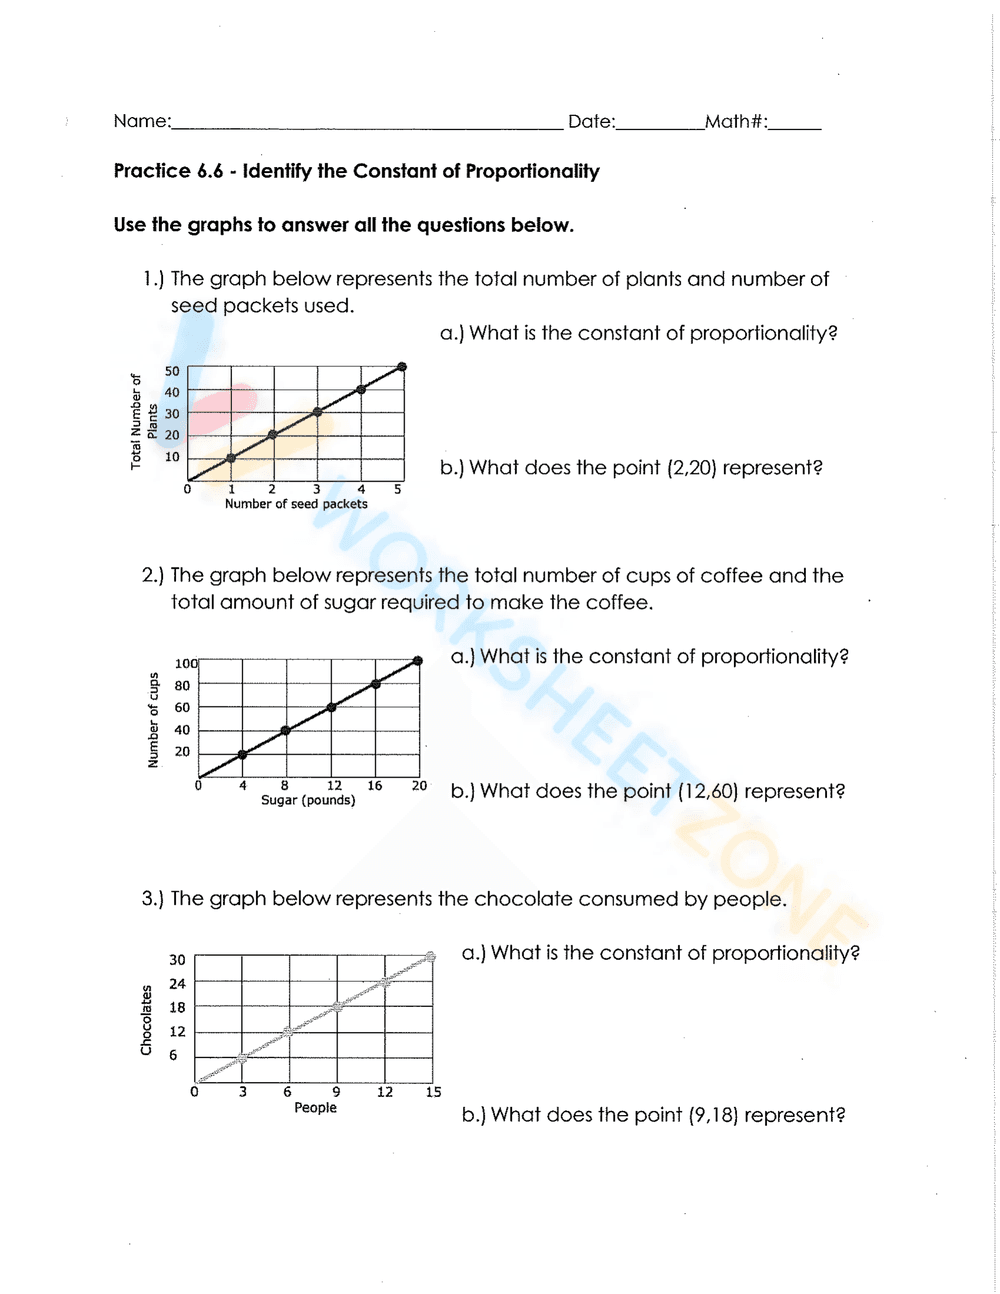
This is a math worksheet titled 'Practice 6.6 - Identify the Constant of Proportionality'. It contains three problems, each featuring a graph. The first graph represents the relationship between the number of plants and seed packets. The second graph represents the relationship between the number of cups of coffee and sugar. The third graph represents the chocolate consumed by people. Each problem asks the student to determine the constant of proportionality from the graph and to interpret the meaning of a specific point on the graph.
Grade Level Suitability:
This worksheet is suitable for 6th and 7th grade students. It aligns with the math curriculum focused on understanding and interpreting proportional relationships and graphs, a core concept introduced in these grades.
Why Use It:
This worksheet helps students develop their ability to identify the constant of proportionality from a graph. It also enhances their understanding of how to interpret points on a graph within the context of a real-world scenario. It reinforces the connection between graphs and proportional relationships.
How to Use It:
Students should analyze each graph to determine the constant of proportionality (the slope of the line). They should then explain what the given point (e.g., (2,20)) represents in the context of the problem. For example, in the first problem, they would need to state what 2 seed packets and 20 plants mean.
Target Users:
The target users are middle school students, particularly those in 6th and 7th grade, who are learning about proportional relationships and how to interpret graphs. It's also useful for teachers looking for practice worksheets to reinforce these concepts.