


1 / 2
0
Views
0
Downloads
0.0
0
Save
0 Likes
Constant of Proportionality: Practice and Learn with Key
0 Views
0 Downloads
Paste this activity's link or code into your existing LMS (Google Classroom, Canvas, Teams, Schoology, Moodle, etc.).
Students can open and work on the activity right away, with no student login required.
You'll still be able to track student progress and results from your teacher account.
Information
Description
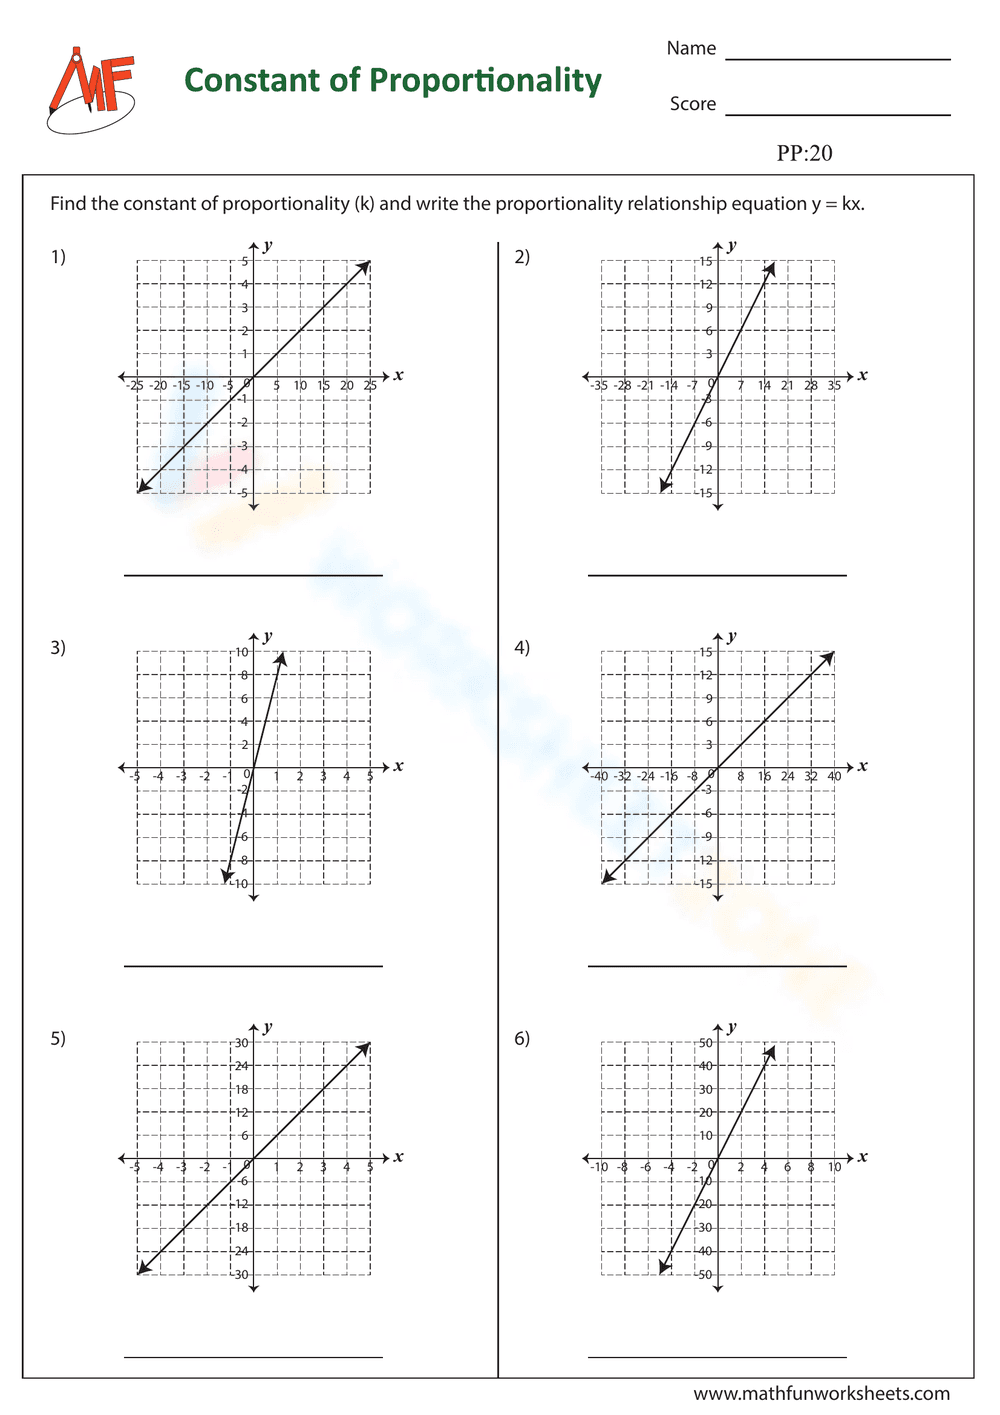
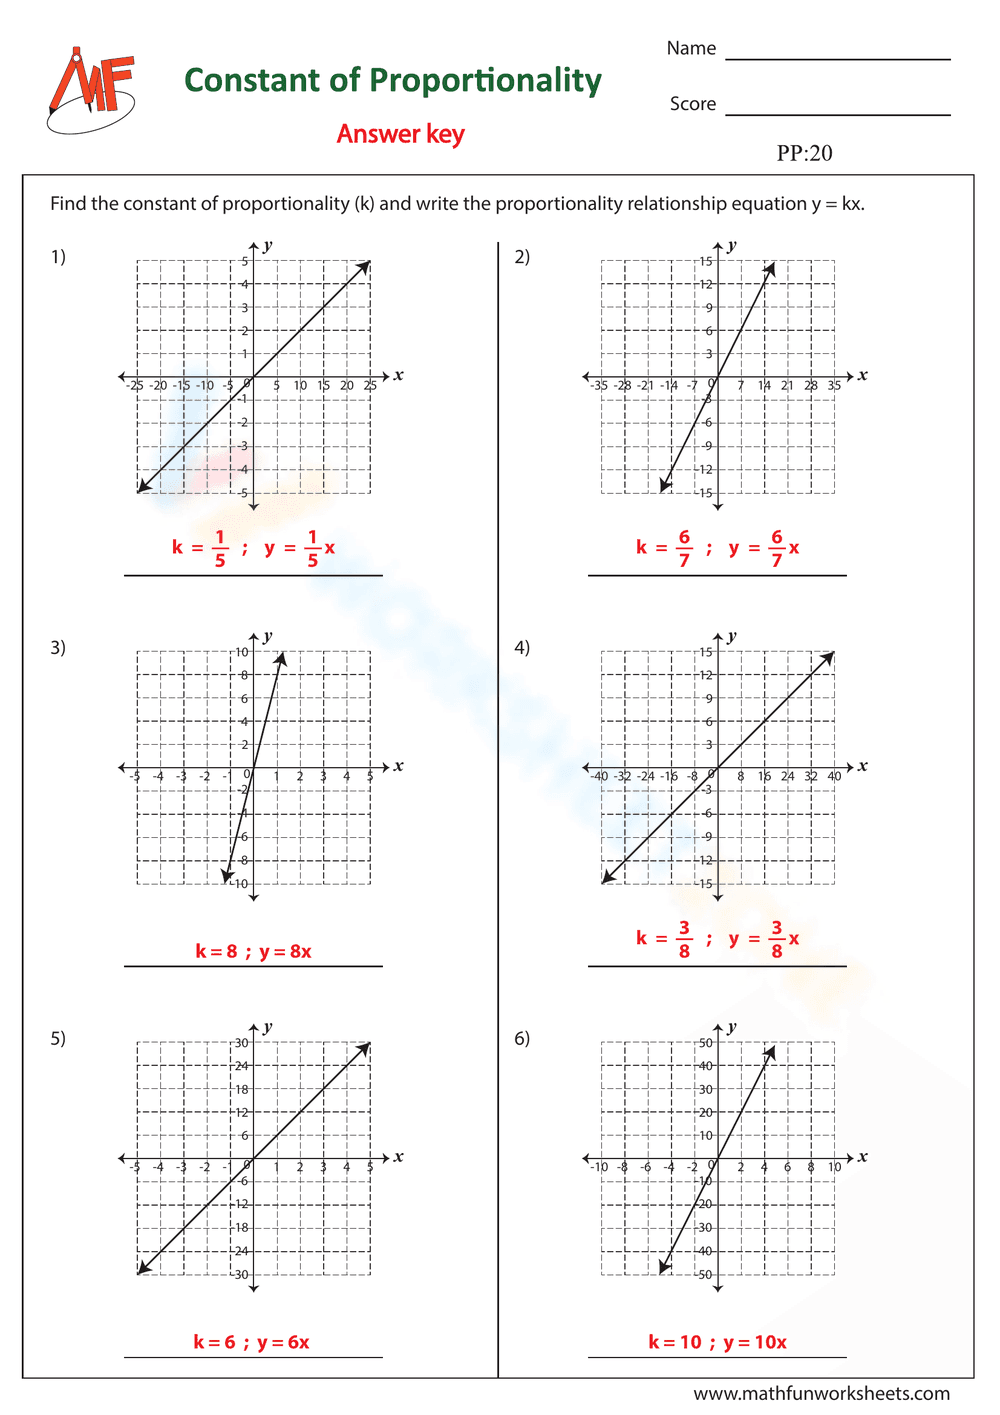
What It Is:
This is a math worksheet focusing on the concept of constant of proportionality. It contains six problems where students are given a graph of a line and are asked to find the constant of proportionality (k) and write the proportionality relationship equation in the form y = kx. Each problem features a different graph plotted on a coordinate plane.
Grade Level Suitability:
This worksheet is most suitable for 7th and 8th grade students. It aligns with the curriculum that introduces linear equations and proportional relationships. Students should have a basic understanding of graphing on a coordinate plane and solving for variables.
Why Use It:
This worksheet helps students to visually understand the concept of constant of proportionality by connecting it to graphical representation. It reinforces their ability to read graphs, identify the slope, and translate that information into an algebraic equation. This exercise strengthens the connection between visual and algebraic representations of proportional relationships.
How to Use It:
Students should analyze each graph to determine the constant of proportionality (k), which is the slope of the line. They can choose any point on the line (other than the origin) and calculate k by dividing the y-coordinate by the x-coordinate (k = y/x). Once they have found k, they can write the equation in the form y = kx and write the equation on the provided line.
Target Users:
The target users are middle school students, specifically those learning about linear equations, proportional relationships, and the constant of proportionality. It's also useful for teachers looking for practice worksheets on this topic.