


Views
Downloads
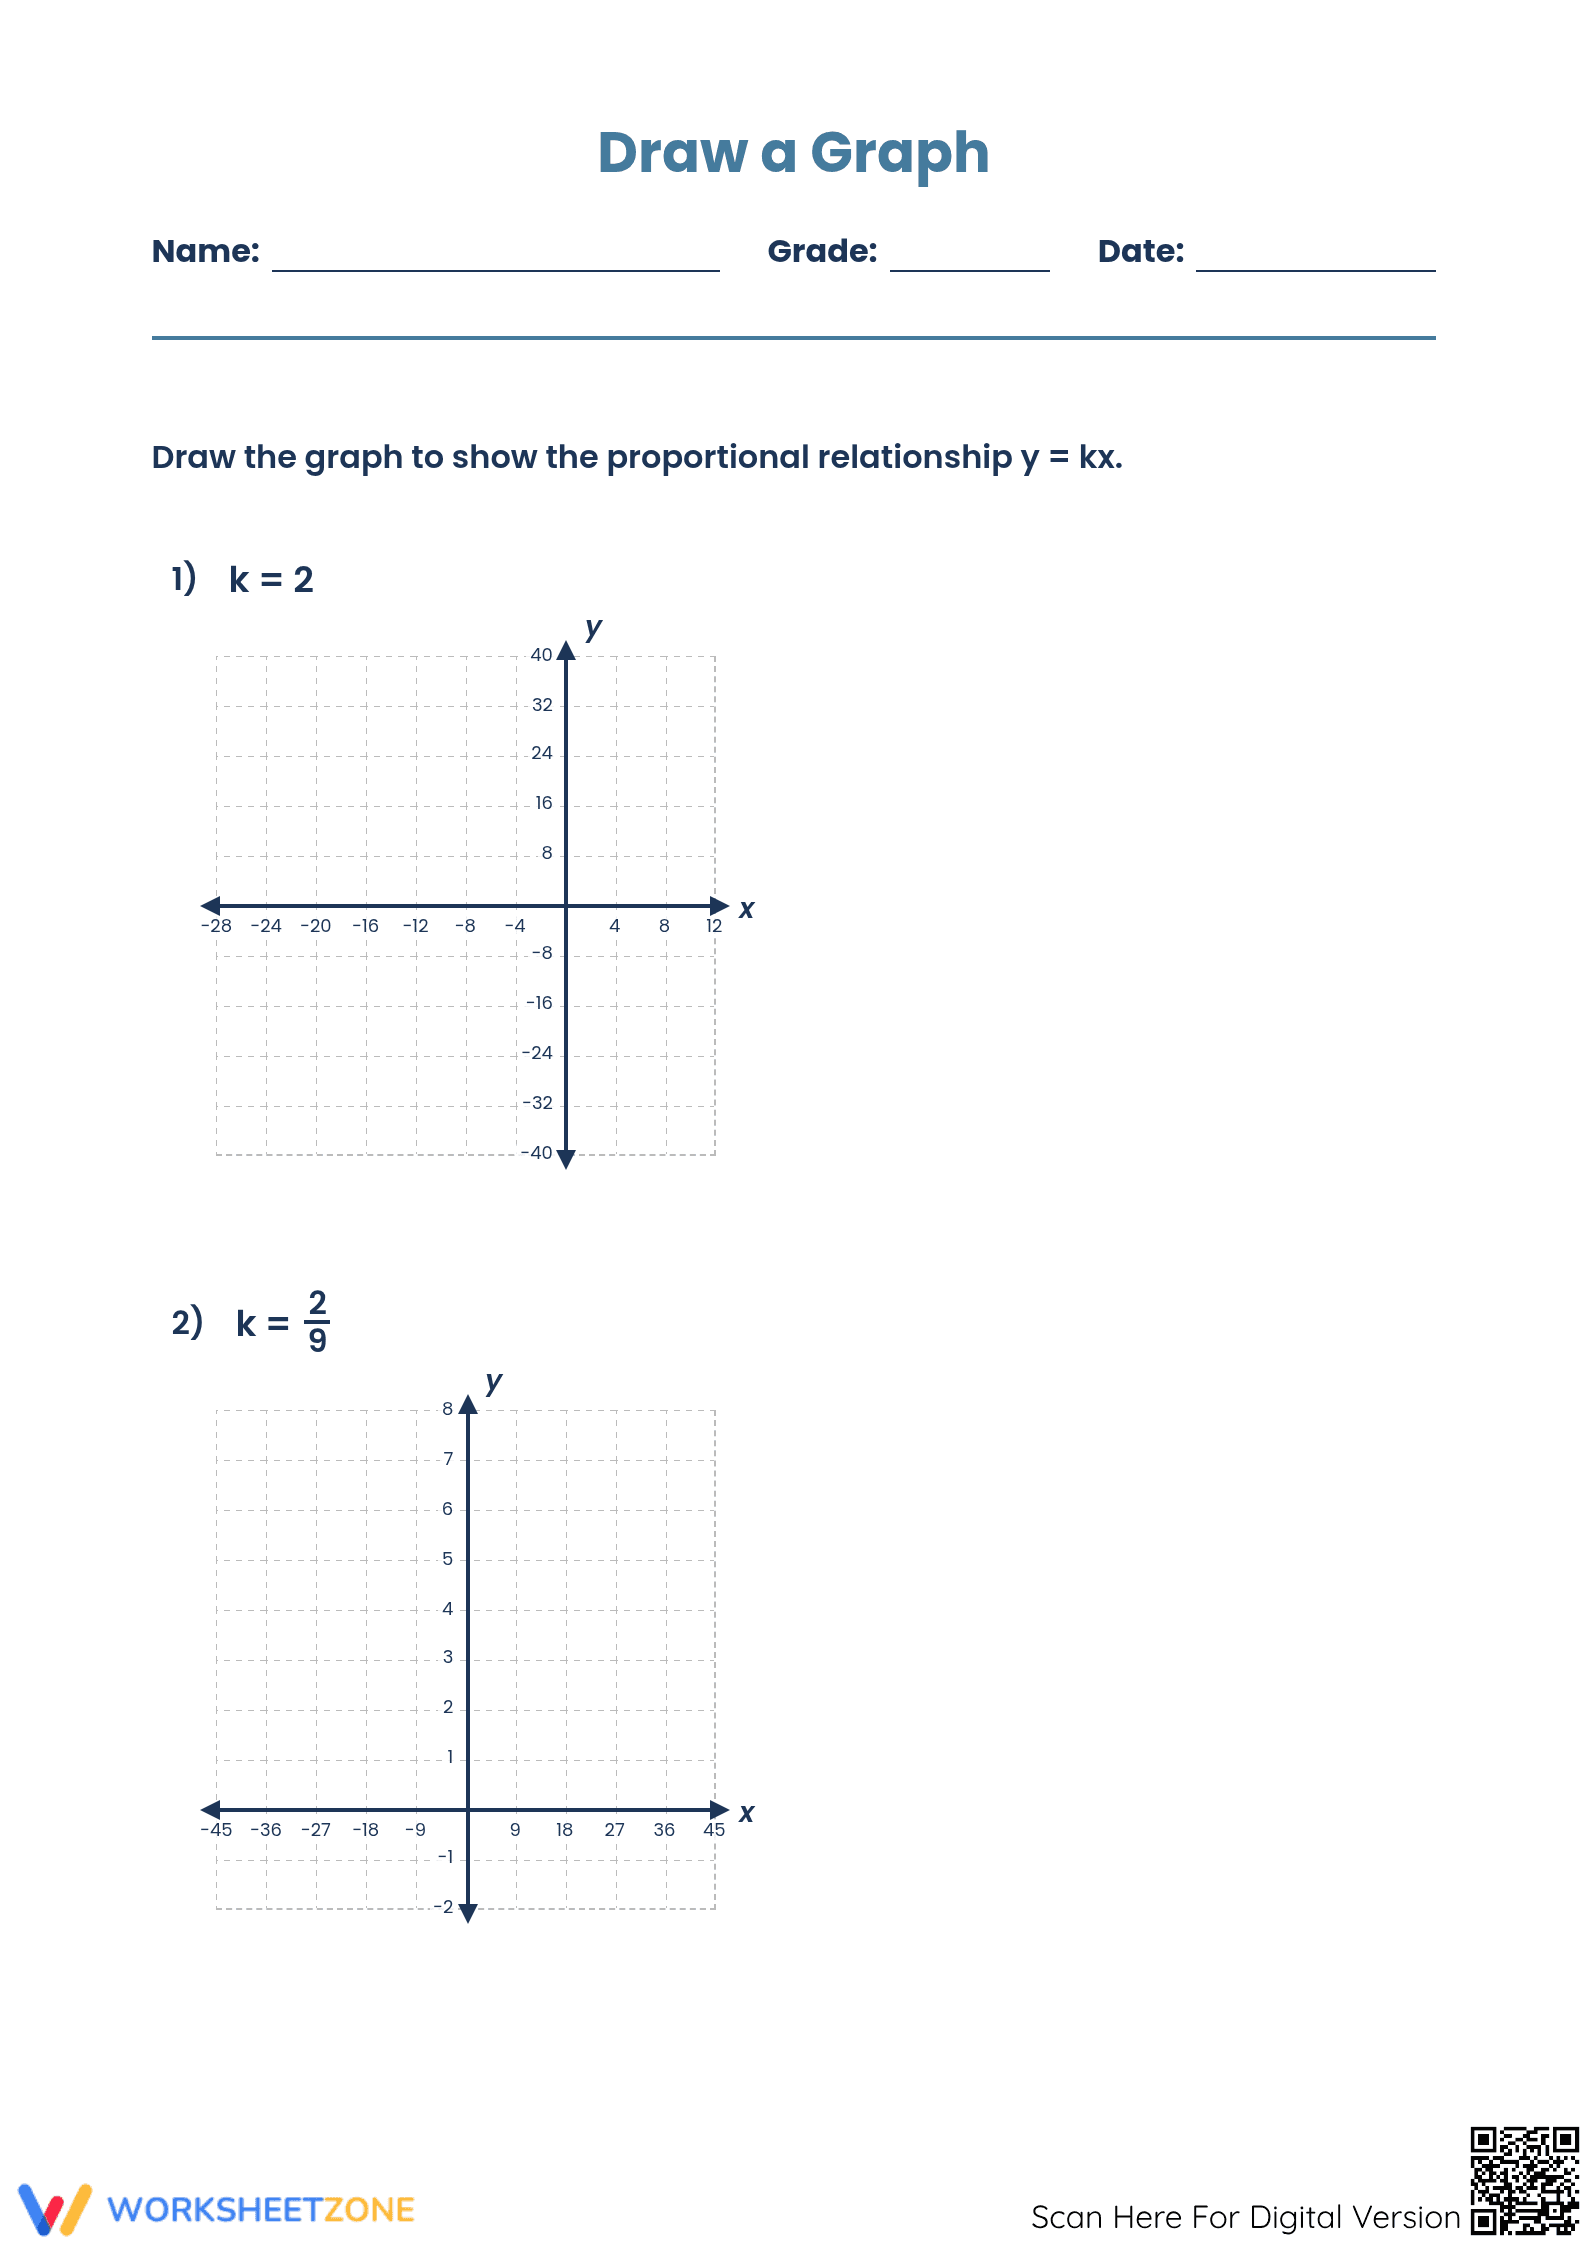
Printable Constant of Proportionality Graphing Worksheet
Paste this activity's link or code into your existing LMS (Google Classroom, Canvas, Teams, Schoology, Moodle, etc.).
Students can open and work on the activity right away, with no student login required.
You'll still be able to track student progress and results from your teacher account.
Students will master the visual representation of proportional relationships using the equation y=kx. This worksheet provides structured practice for Grade 7 learners to plot linear graphs through the origin based on given constants of proportionality. By completing these tasks, students build a concrete understanding of how unit rates determine the steepness and direction of a line.
At a Glance
At a Glance
- Grade: 7 · Subject: Math
- Standard:
7.RP.A.2.A— Graph proportional relationships and observe whether the graph is a straight line- Skill Focus: Graphing y=kx equations
- Format: 3 pages · 6 problems · Answer key included · PDF
- Best For: Independent practice after direct instruction
- Time: 20–30 minutes
What's Inside
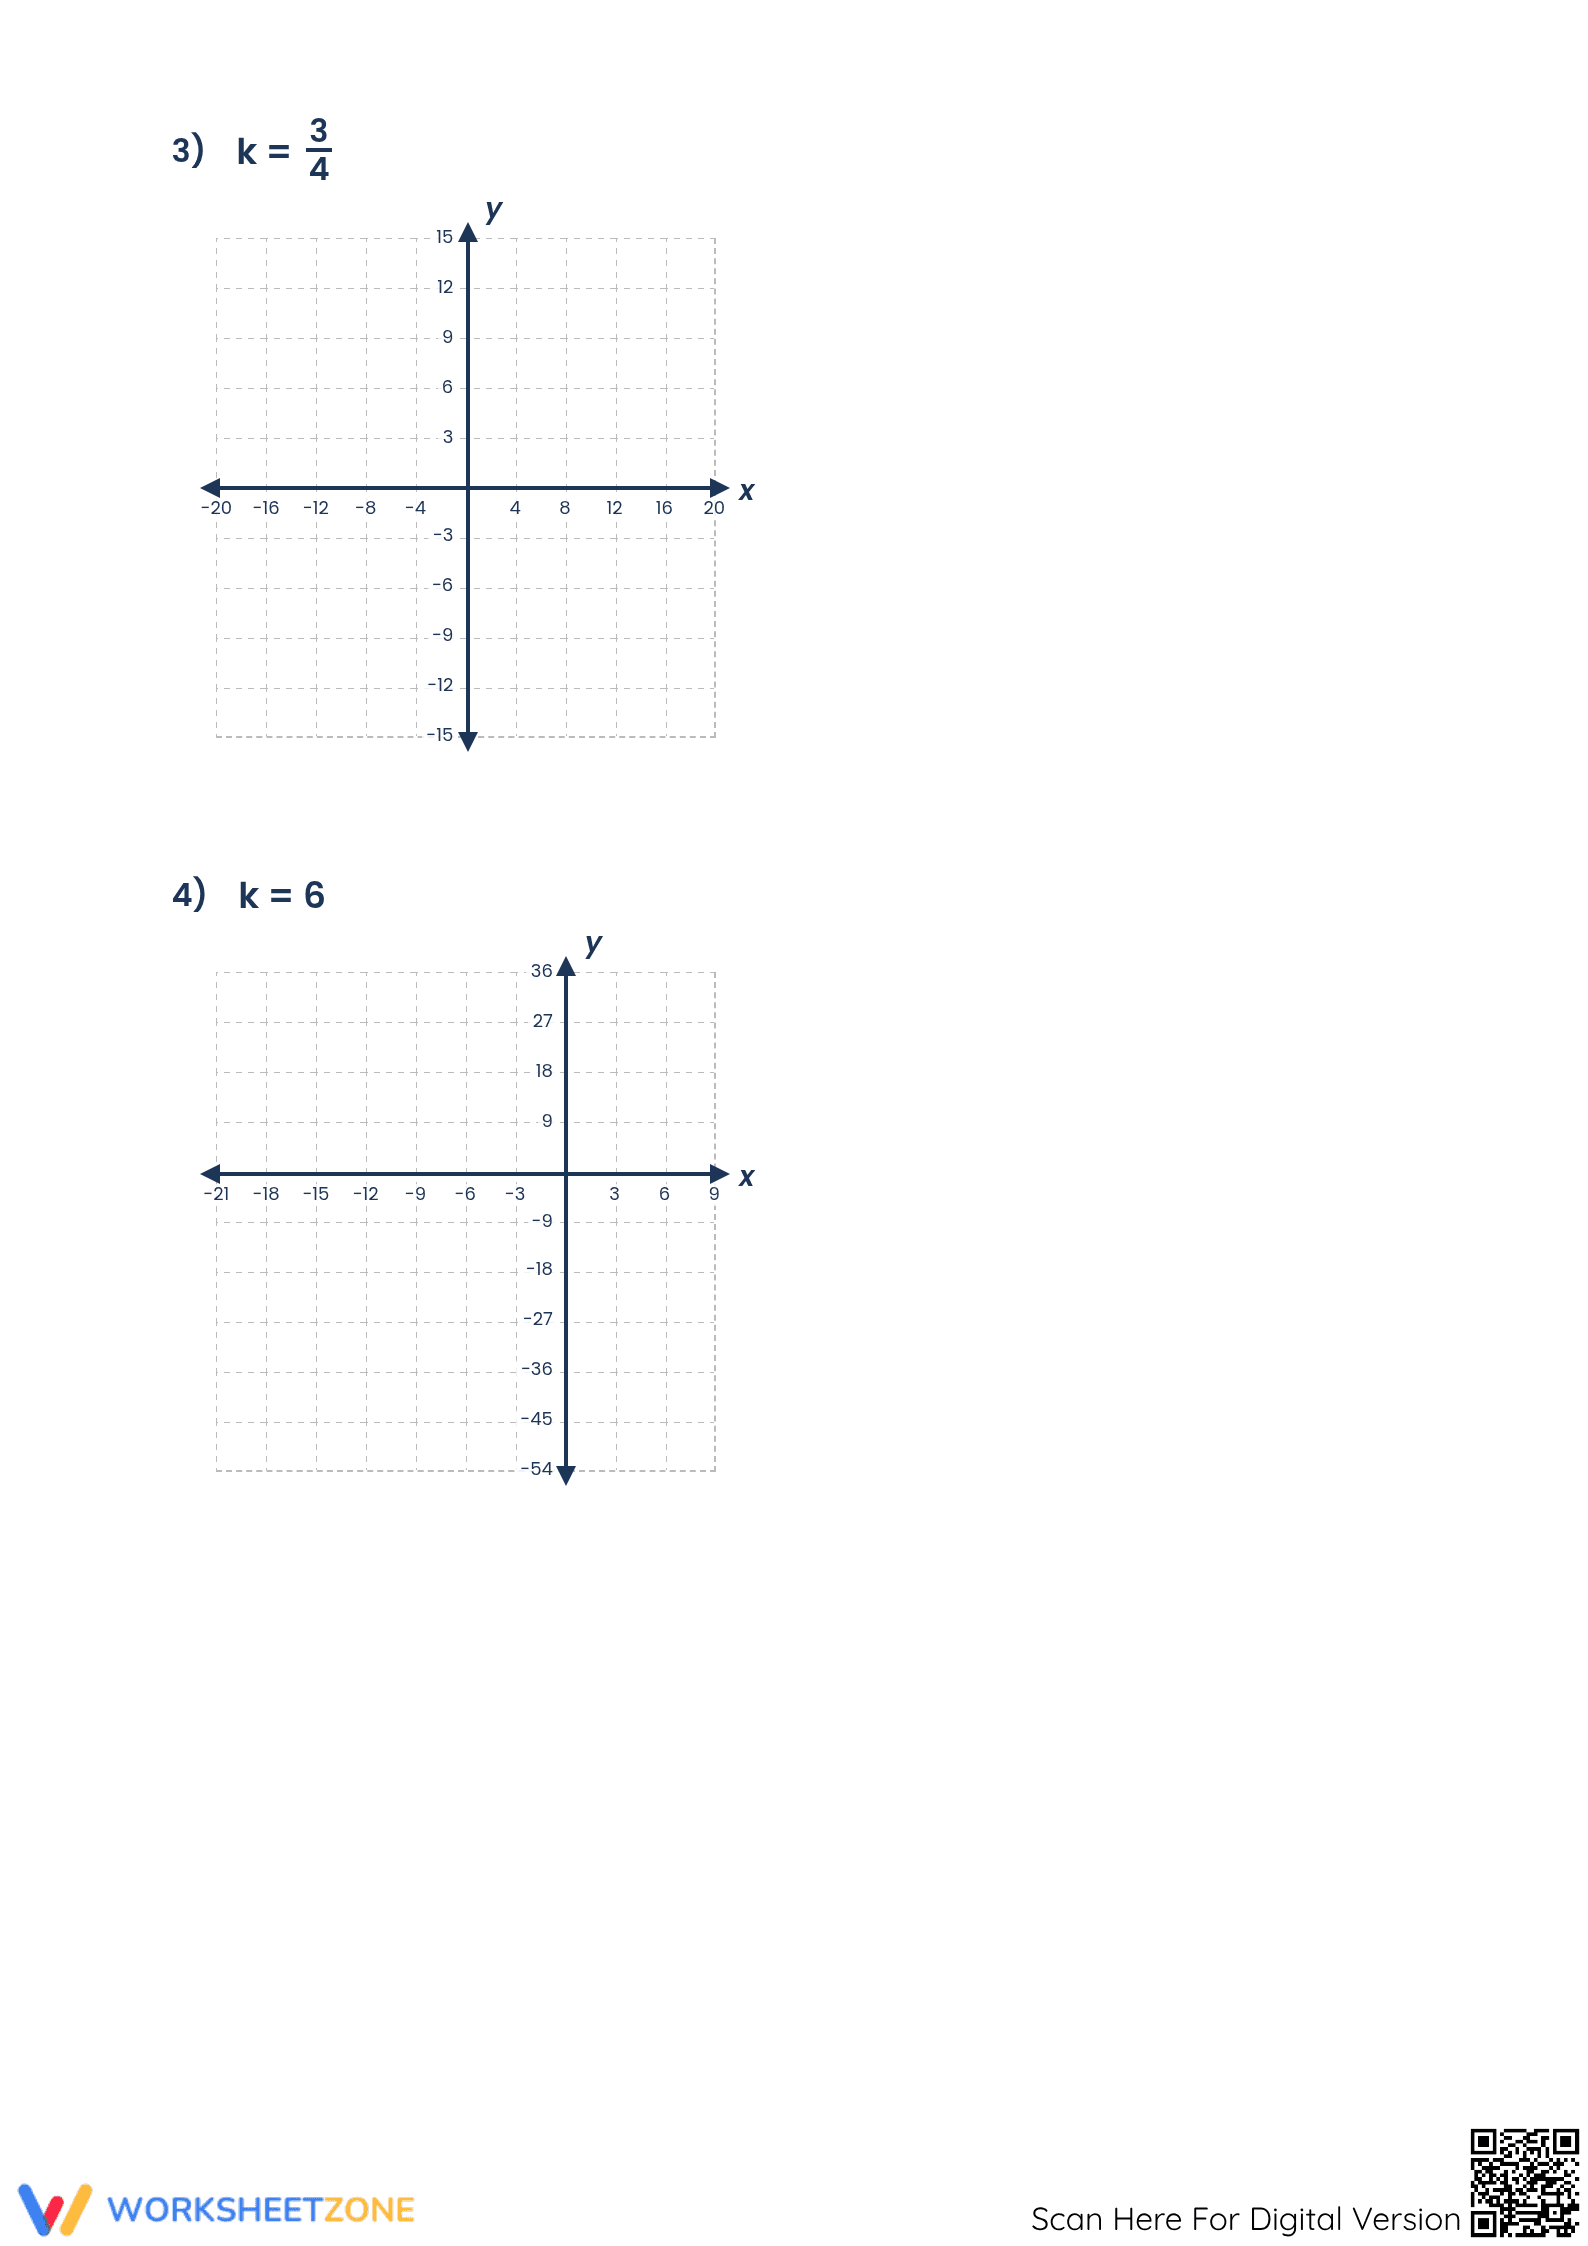
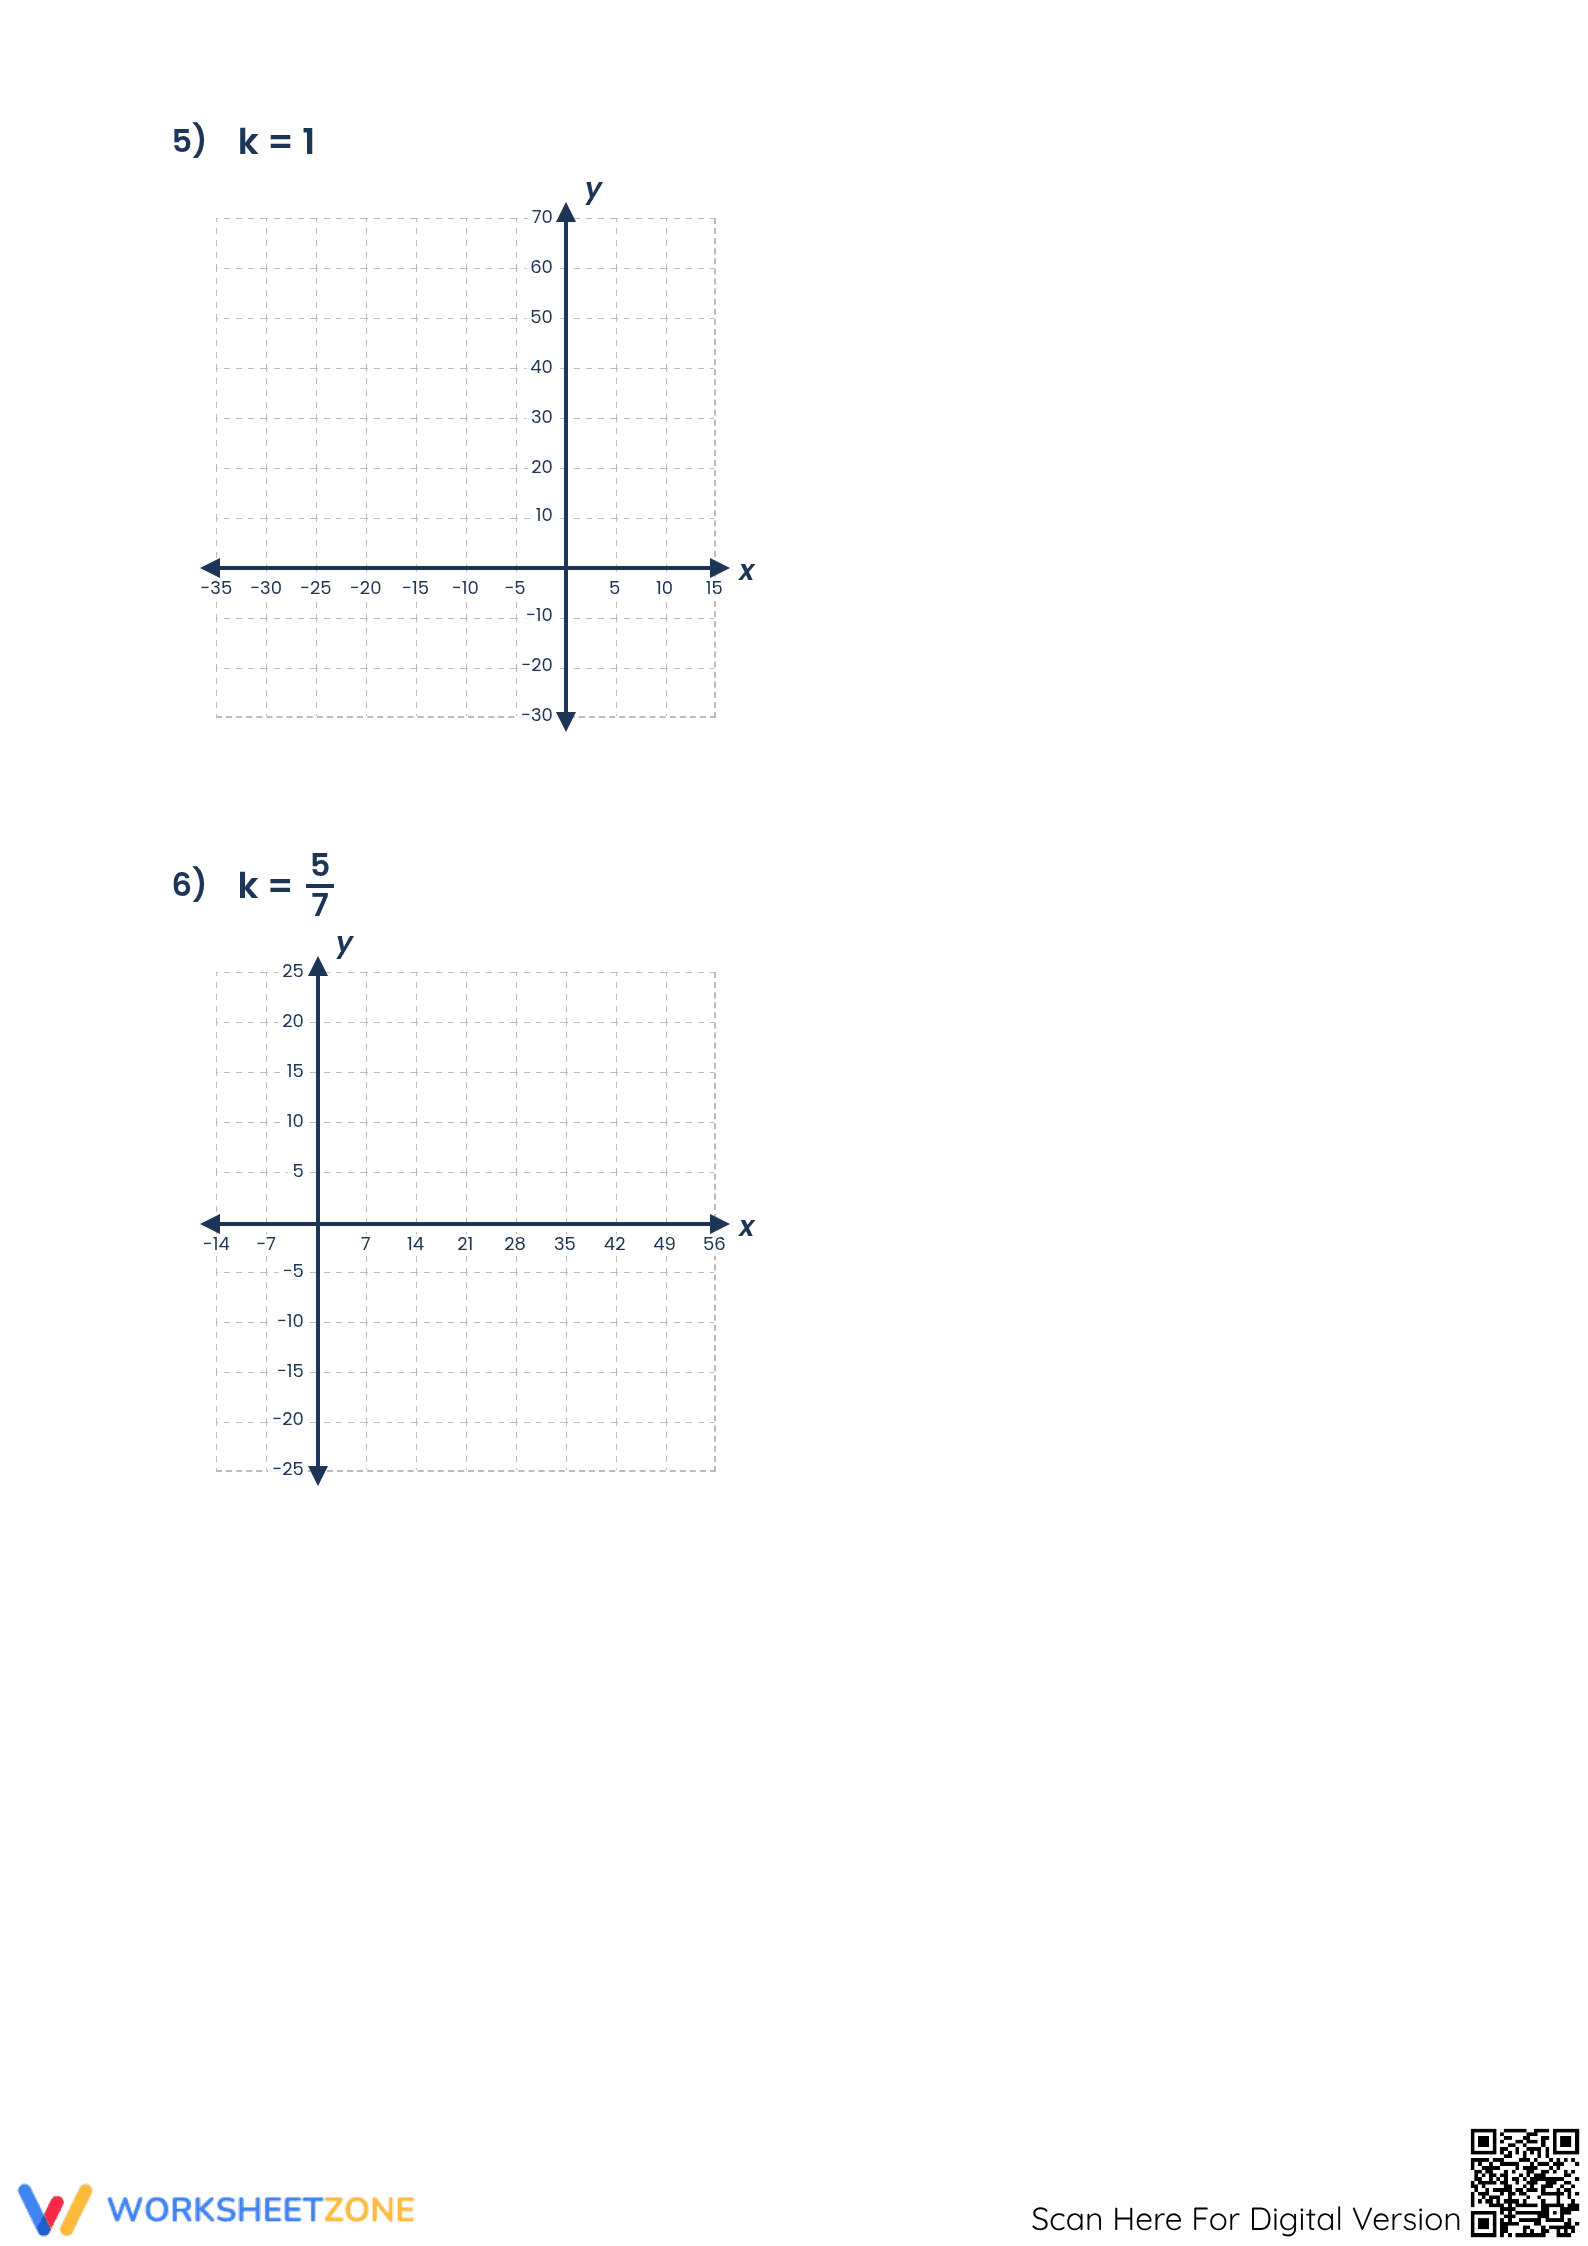
This comprehensive 3-page PDF resource contains six distinct graphing challenges. Each problem presents a unique constant of proportionality (k), ranging from integers to fractions like 2/9. Students are provided with custom-scaled coordinate planes for each task. A full answer key with completed graphs is included for rapid teacher grading or student self-correction.
Zero-Prep Workflow
This resource is designed for immediate classroom integration with a total teacher preparation time of under 2 minutes. First, print the 3-page set (30 seconds). Next, distribute the sheets to students as a bell-ringer, exit ticket, or homework assignment (30 seconds). Finally, use the provided answer key to review student work or project the correct graphs on a whiteboard for whole-class feedback (60 seconds). Its self-explanatory nature makes it an ideal choice for emergency substitute plans.
Standards Alignment
The primary standard addressed is `7.RP.A.2.A`, requiring students to graph proportional relationships and observe whether the graph is a straight line through the origin. It also supports `7.RP.A.2.B` regarding unit rates. Both standard codes can be copied directly into lesson plans, IEP goals, or district curriculum mapping tools. This alignment ensures that students are practicing the exact skills required for middle school mastery of linear functions.
How to Use It
Use this worksheet during the "You Do" phase of a gradual release lesson on ratios. After demonstrating how to plot the point (1, k), assign these problems to verify that students can independently translate an equation into a visual line. For a formative assessment tip, observe whether students are drawing their lines through the origin (0,0); this is a critical indicator of their understanding of proportional constants versus general linear functions. Most students complete the set in 25 minutes.
Who It's For
This resource is tailored for seventh-grade math students transitioning from ratio tables to algebraic graphing. It provides scaffolding for inclusive classrooms through pre-labeled axes and varying complexity in unit rates. It pairs naturally with an anchor chart or a short instructional lesson on the meaning of 'k' in the coordinate plane. It is also suitable for Grade 8 students requiring a quick review of linear foundations.
This Grade 7 mathematics resource aligns with `7.RP.A.2.A` by focusing on the graphical representation of proportional relationships. Research from `Fisher & Frey (2014)` emphasizes that graphing is a vital scaffold in the gradual release of responsibility model, moving students from abstract equations to concrete visual evidence of linearity. By plotting y=kx across six distinct scenarios, students internalize how the constant of proportionality dictates the rate of change. Studies such as the `RAND AIRS 2024` report indicate that targeted practice with coordinate planes significantly improves middle school students' performance on standardized algebraic thinking assessments. This worksheet ensures students meet the rigorous demands of the Common Core by providing enough repetition to solidify the connection between unit rates and slopes. The inclusion of fractional constants ensures that learners are prepared for higher-order secondary mathematics where rates are rarely simple integers.