


Views
Downloads

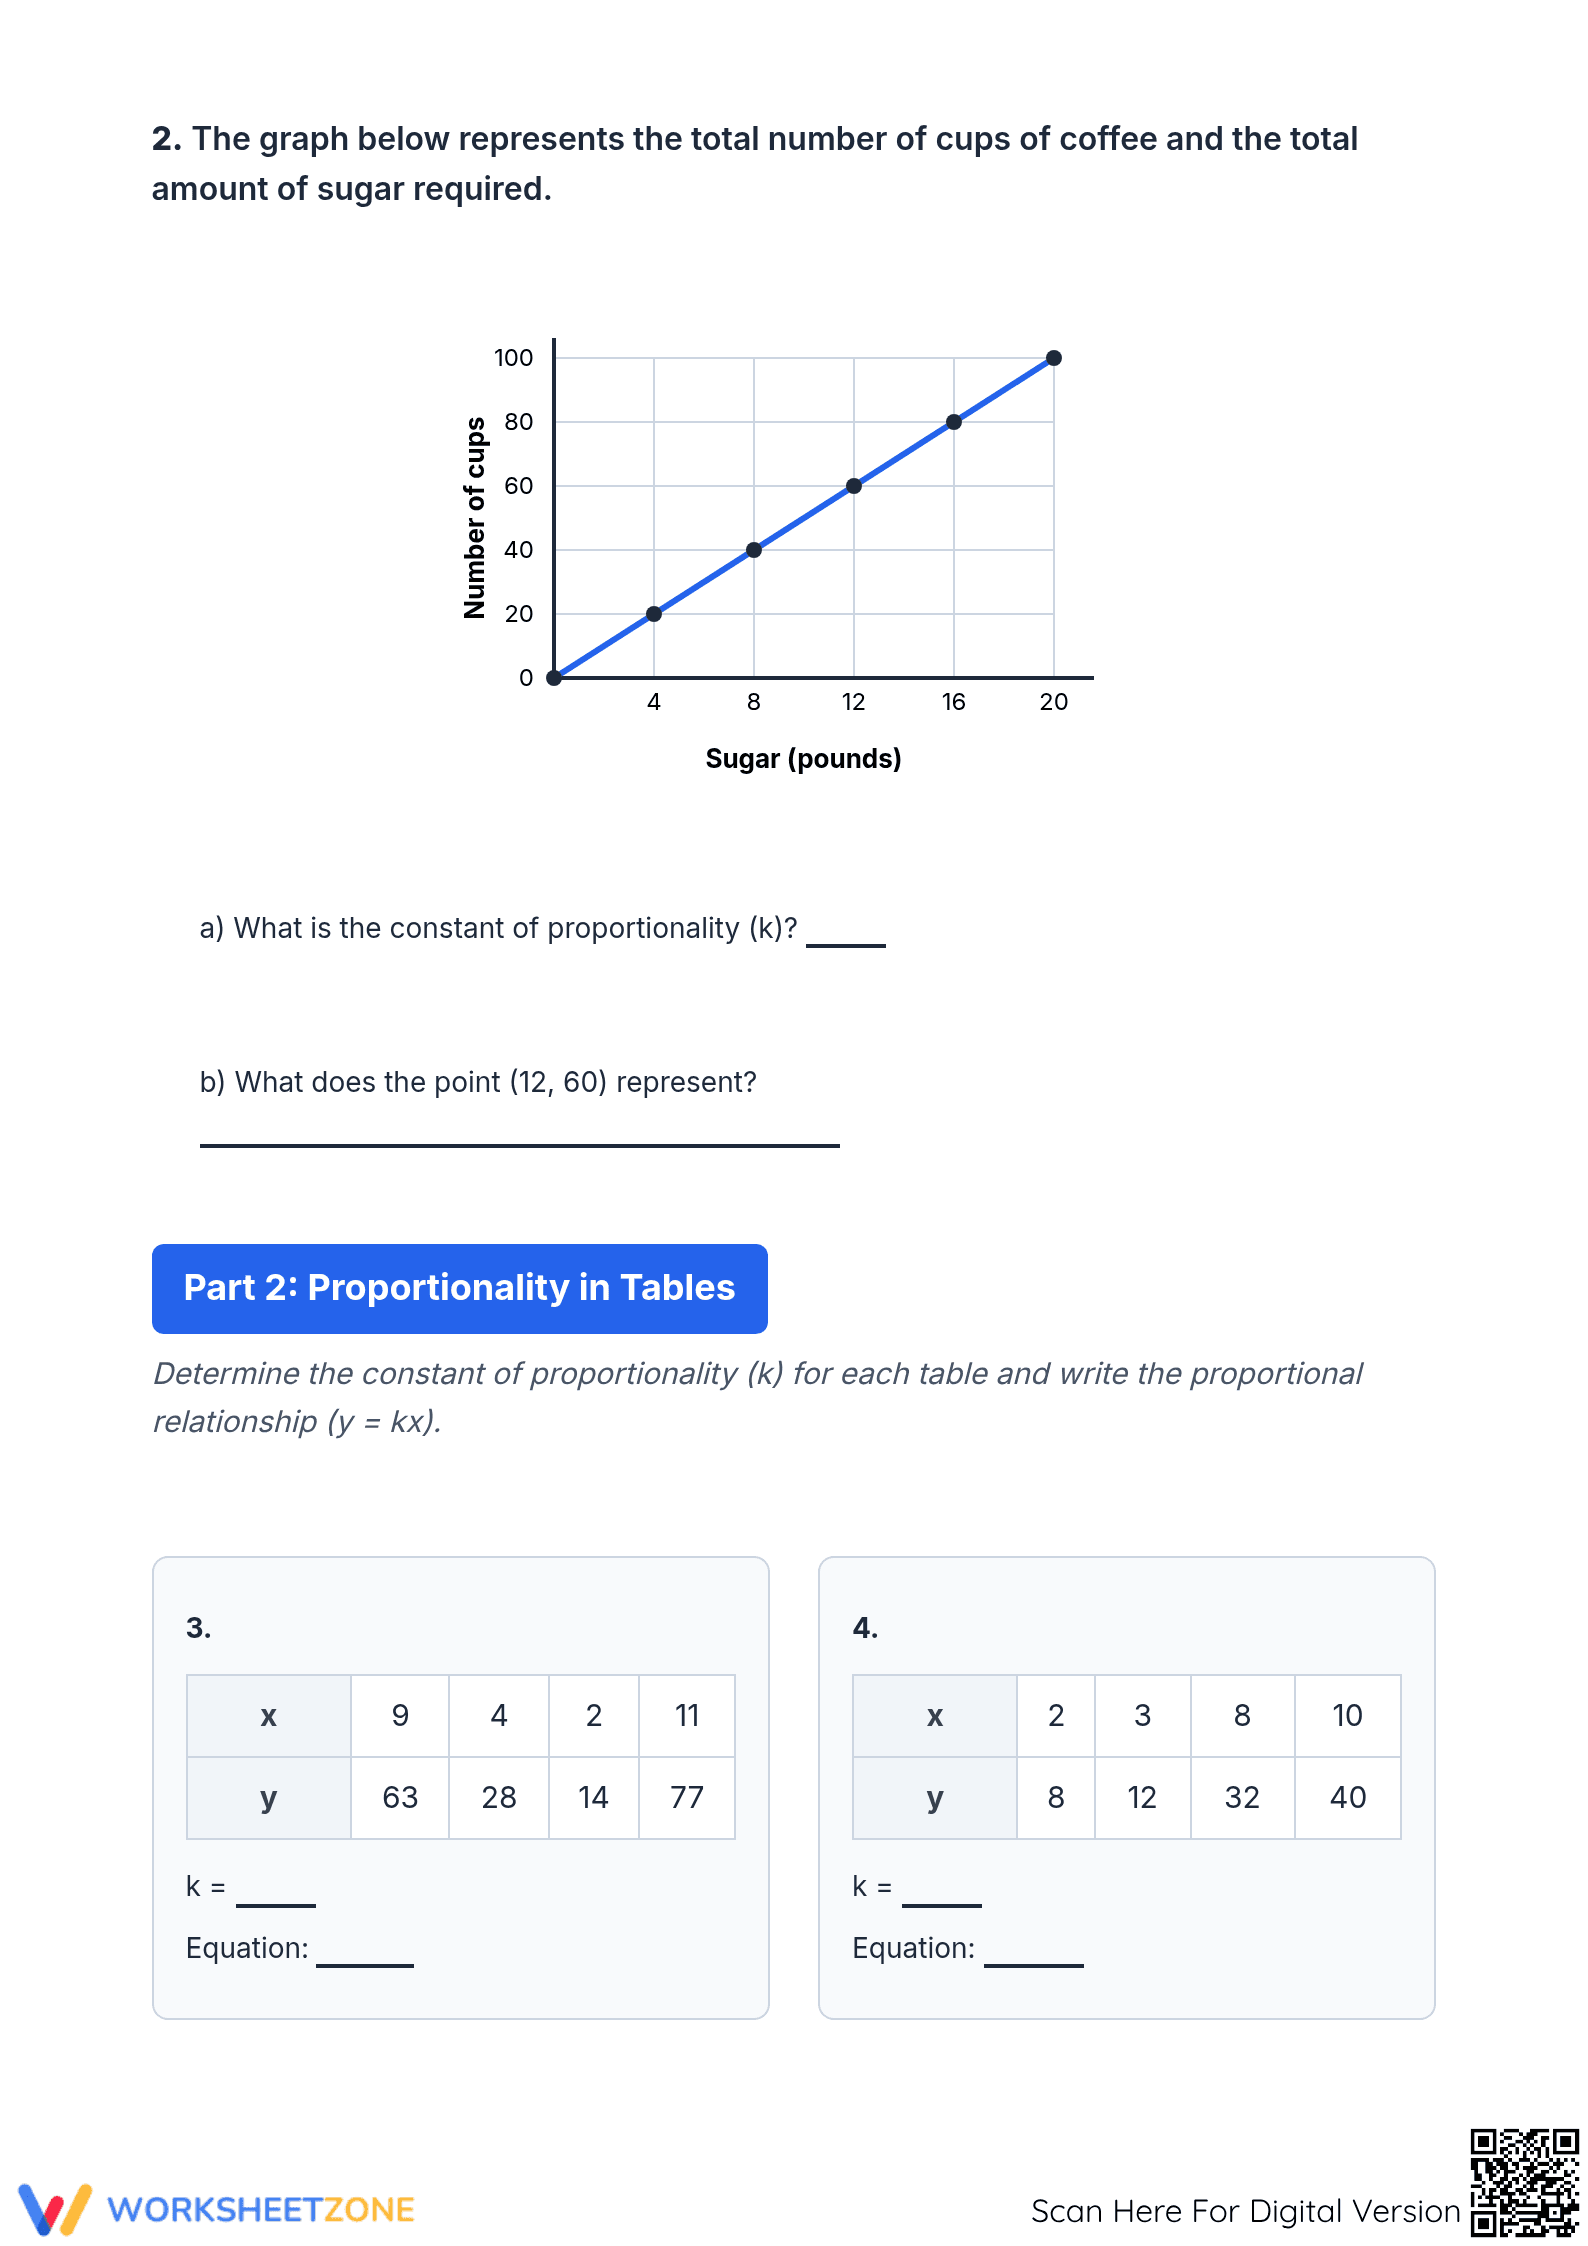

Essential Constant of Proportionality Practice | Grade 7
Paste this activity's link or code into your existing LMS (Google Classroom, Canvas, Teams, Schoology, Moodle, etc.).
Students can open and work on the activity right away, with no student login required.
You'll still be able to track student progress and results from your teacher account.
This comprehensive 4-page worksheet helps students master the constant of proportionality (k) through diverse visual representations. By analyzing proportional graphs and tables, learners develop a concrete understanding of unit rates and the relationship between variables. This essential practice set ensures students can transition between graphical and tabular data with accuracy and confidence.
At a Glance
- Grade: 7 · Subject: Math
- Standard:
7.RP.A.2.B— Identify the constant of proportionality in tables, graphs, equations, and diagrams- Skill Focus: Constant of Proportionality (k)
- Format: 4 pages · 16 problems · Answer key included · PDF
- Best For: Middle school ratio and proportion units
- Time: 45–60 minutes
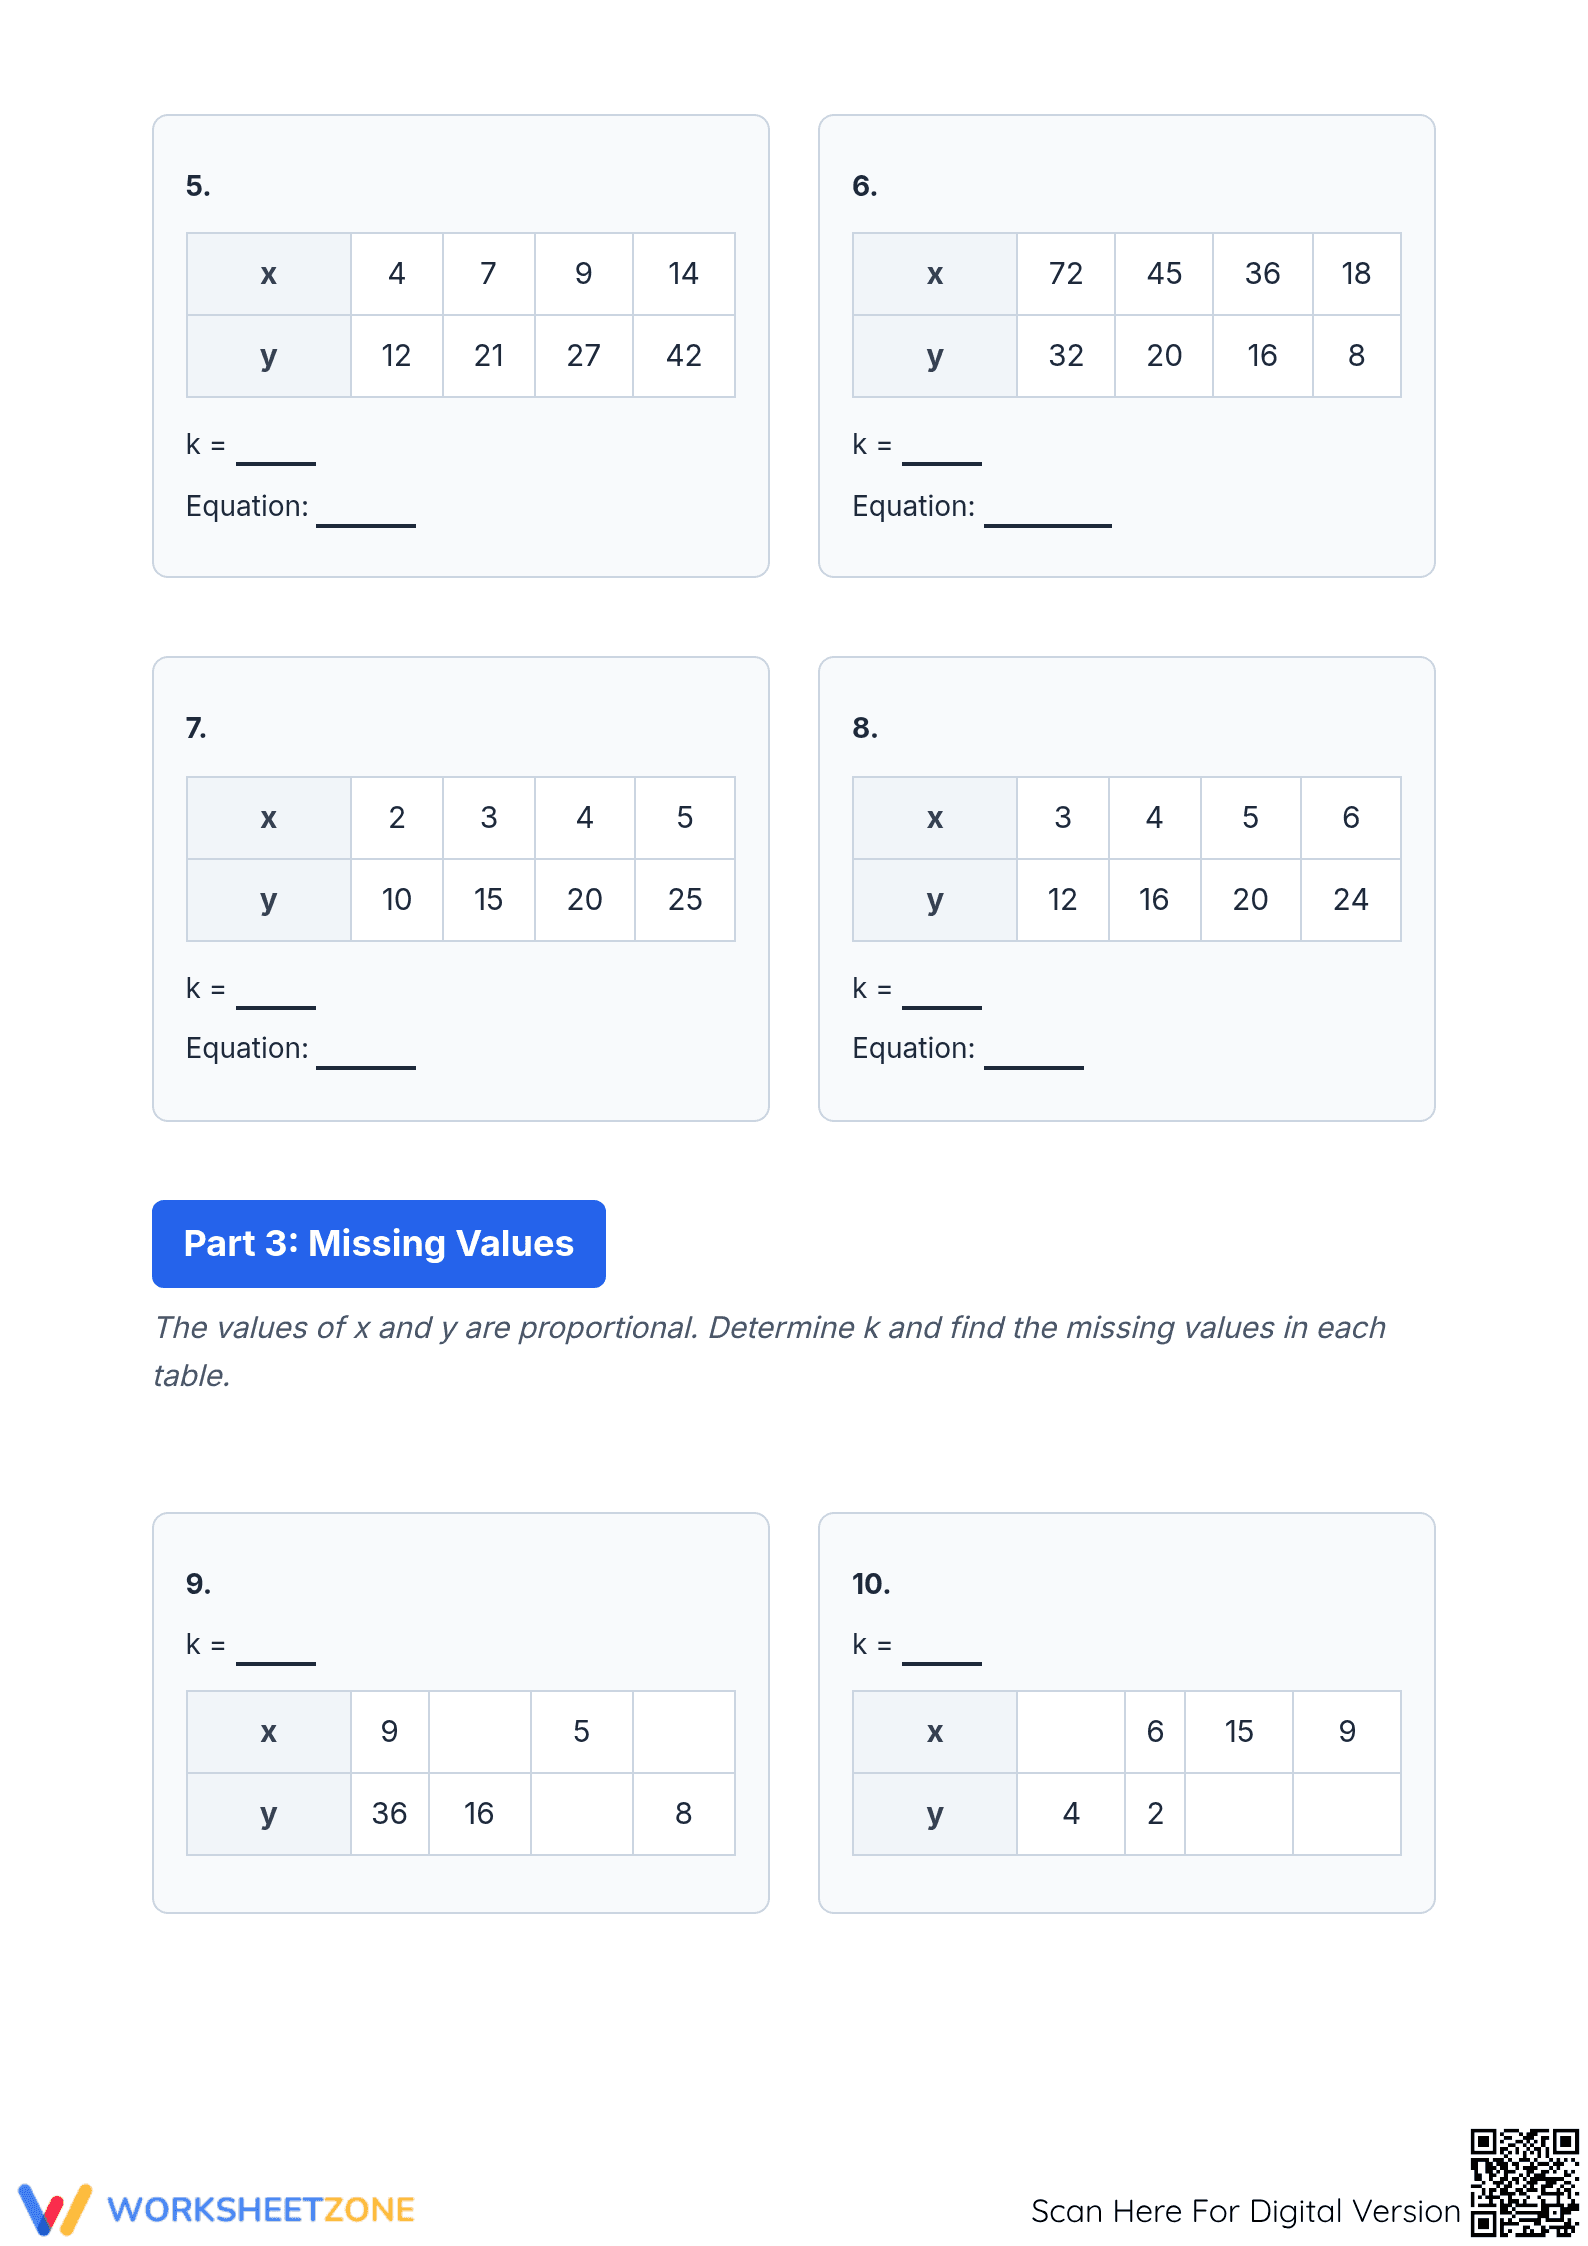
This practice set contains 16 structured problems distributed across four pages. Part 1 features graphical analysis where students identify k and interpret specific coordinate points. Part 2 moves to tabular data, requiring students to calculate the ratio y/x and write the corresponding proportional equation (y = kx). Part 3 challenges students to find missing values within proportional tables by applying the constant they have identified. A complete answer key is provided for rapid grading.
- Guided Practice: The worksheet begins with visual graphs (Problems 1-2), providing a clear spatial context for unit rates. Students are prompted to interpret points like (x, y) to solidify their conceptual understanding.
- Supported Practice: Students then move to tables (Problems 3-8), where they must systematically calculate k and translate that value into a formal algebraic equation.
- Independent Practice: The final section (Problems 9-16) requires students to apply their knowledge to solve for unknown variables, representing the final stage of skill mastery.
This resource is explicitly aligned with 7.RP.A.2.B: "Identify the constant of proportionality (unit rate) in tables, graphs, equations, diagrams, and verbal descriptions of proportional relationships." It also supports 7.RP.A.2.A by requiring students to verify proportionality through constant ratios. Both standard codes can be copied directly into lesson plans, IEP goals, or district curriculum mapping tools.
Use this worksheet during the independent practice phase of a gradual release lesson on ratios and proportions. It serves as an excellent formative assessment tool; teachers should observe if students are correctly identifying the y-variable on graphs before calculating the ratio. The expected completion time is 45 to 60 minutes, making it ideal for a full class period or a comprehensive homework assignment.
This resource is designed for Grade 7 math students but is also appropriate for Grade 8 remediation or advanced Grade 6 learners. It provides necessary scaffolds for students who struggle with abstract algebra by grounding the math in visual graphs. This worksheet pairs naturally with a direct instruction lesson on coordinate planes and unit rates.
Effective mathematics instruction requires multiple representations to bridge the gap between concrete and abstract thinking. Research by Fisher & Frey (2014) emphasizes the importance of a gradual release of responsibility model, which this worksheet follows by transitioning from visual graphs to abstract table calculations. Students who engage with both graphical and tabular data are more likely to internalize the concept of unit rates, a foundational skill for success in Algebra I. By requiring students to not only find the constant of proportionality but also write the equation and solve for missing values, this resource aligns with high-yield instructional strategies identified in the RAND AIRS 2024 report on middle school numeracy. The inclusion of clear visual anchors ensures that the standard 7.RP.A.2.B is addressed with the rigor required for college and career readiness benchmarks.