


1 / 2
0
Views
0
Downloads
0.0
0
Save
0 Likes
Constant of Proportionality Worksheet with Answer Key
0 Views
0 Downloads
Paste this activity's link or code into your existing LMS (Google Classroom, Canvas, Teams, Schoology, Moodle, etc.).
Students can open and work on the activity right away, with no student login required.
You'll still be able to track student progress and results from your teacher account.
Information
Description
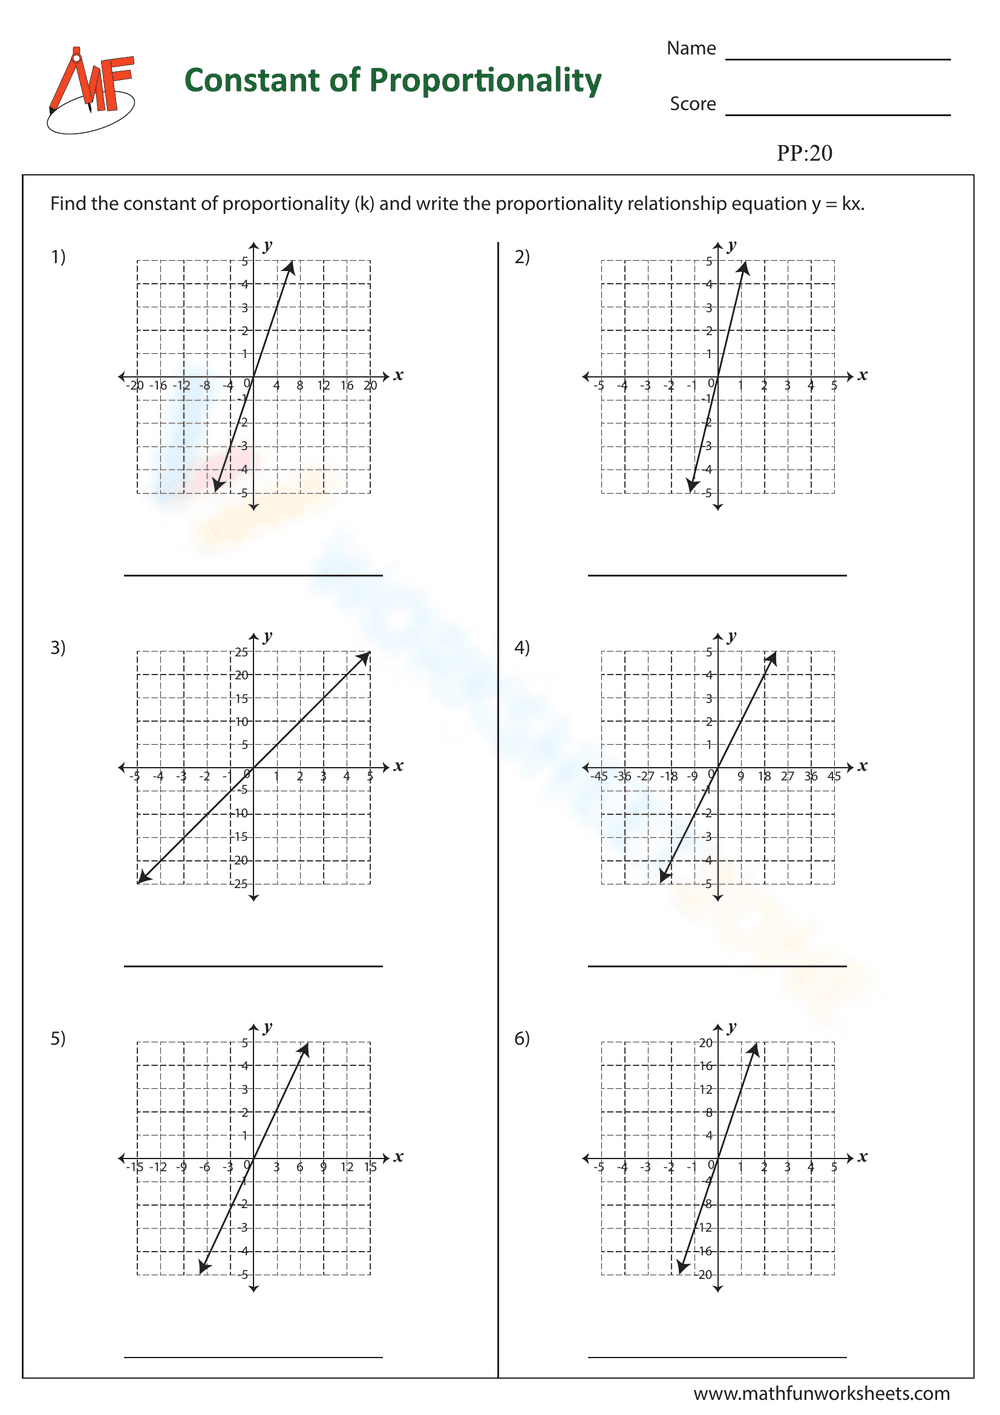
What It Is:
This is a math worksheet focused on constant of proportionality. It presents six coordinate plane graphs with straight lines passing through the origin. The task is to find the constant of proportionality (k) for each graph and then write the corresponding proportionality relationship equation in the form y = kx. Each graph has a space below it to write the answer.
Grade Level Suitability:
This worksheet is suitable for grades 7-9. It requires understanding of coordinate planes, linear equations, and the concept of constant of proportionality, which are typically introduced in these grades.
Why Use It:
This worksheet helps students practice identifying the constant of proportionality from a graph and expressing it as a linear equation. It reinforces the understanding of direct variation and the relationship between graphs and equations.
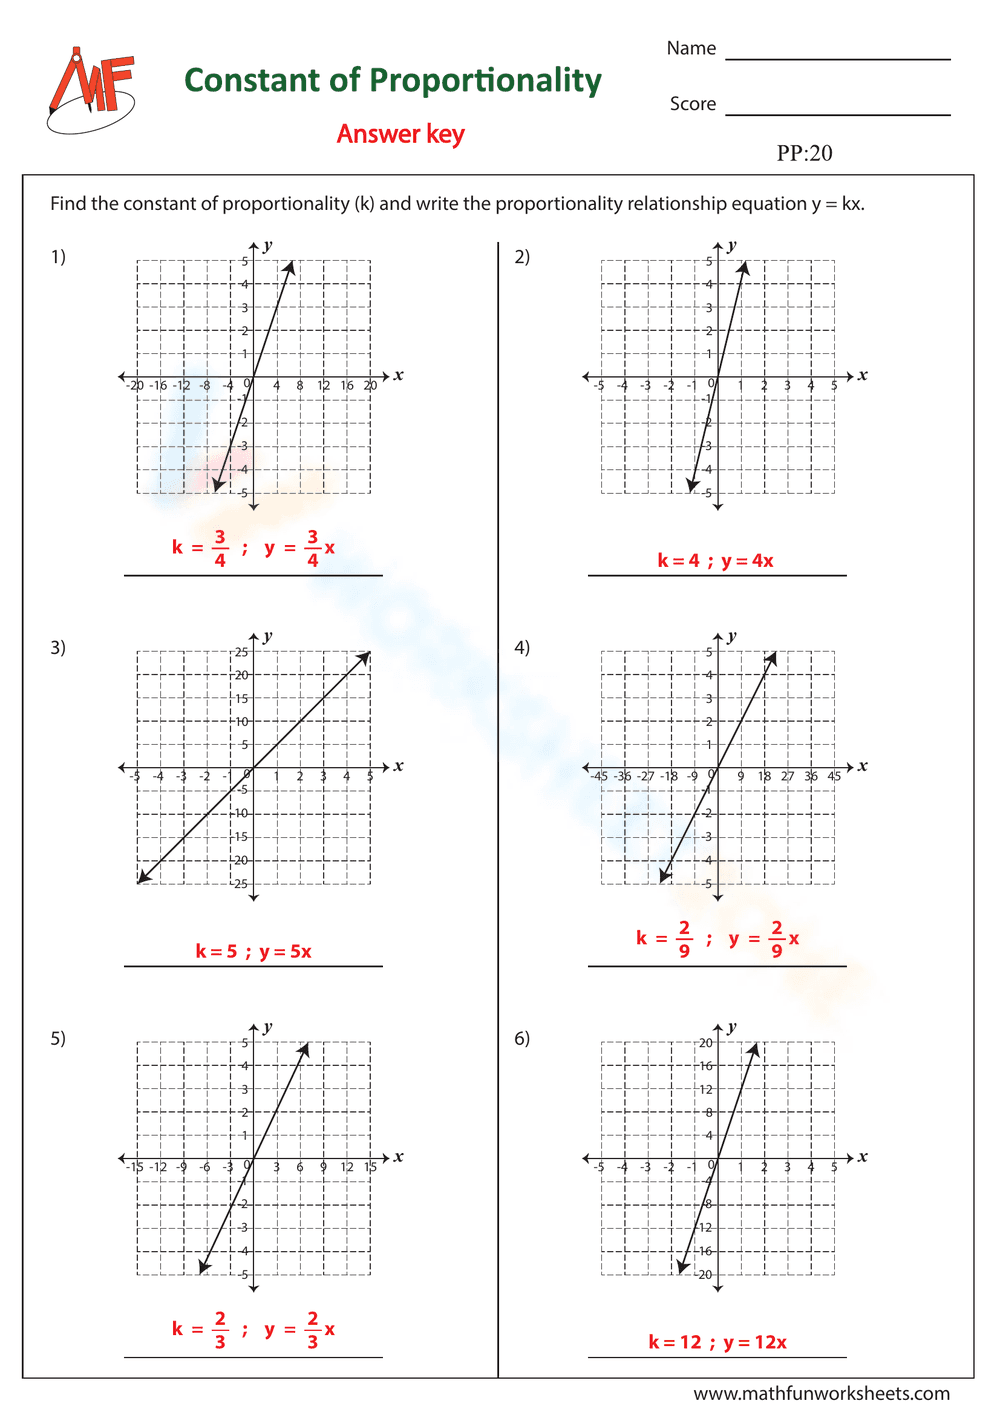
How to Use It:
Students should analyze each graph to determine the slope of the line, which represents the constant of proportionality (k). They can choose a point on the line (other than the origin) and use the coordinates to calculate k (k = y/x). Then, they write the equation y = kx using the calculated value of k in the space provided.
Target Users:
This worksheet is designed for middle school and early high school students learning about linear equations, graphing, and constant of proportionality. It can be used for classroom practice, homework assignments, or review activities.
This is a math worksheet focused on constant of proportionality. It presents six coordinate plane graphs with straight lines passing through the origin. The task is to find the constant of proportionality (k) for each graph and then write the corresponding proportionality relationship equation in the form y = kx. Each graph has a space below it to write the answer.
Grade Level Suitability:
This worksheet is suitable for grades 7-9. It requires understanding of coordinate planes, linear equations, and the concept of constant of proportionality, which are typically introduced in these grades.
Why Use It:
This worksheet helps students practice identifying the constant of proportionality from a graph and expressing it as a linear equation. It reinforces the understanding of direct variation and the relationship between graphs and equations.
How to Use It:
Students should analyze each graph to determine the slope of the line, which represents the constant of proportionality (k). They can choose a point on the line (other than the origin) and use the coordinates to calculate k (k = y/x). Then, they write the equation y = kx using the calculated value of k in the space provided.
Target Users:
This worksheet is designed for middle school and early high school students learning about linear equations, graphing, and constant of proportionality. It can be used for classroom practice, homework assignments, or review activities.