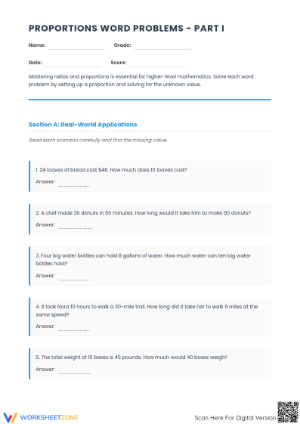
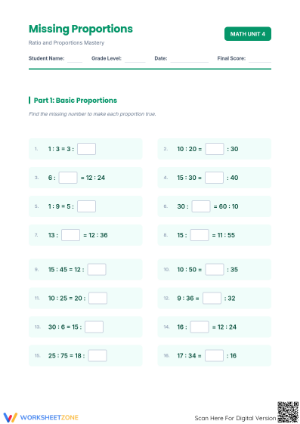
What Proportional Relationship Worksheets Actually Teach
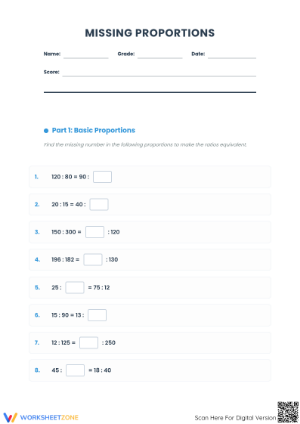
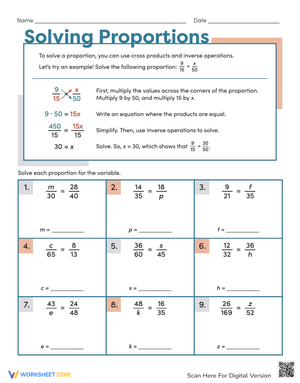
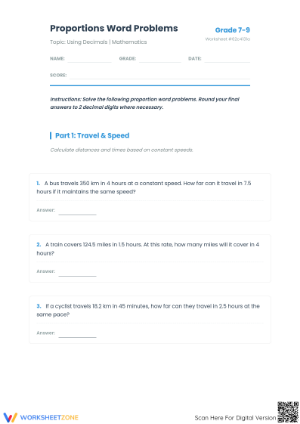
Proportional relationship worksheets give grade 7 students repeated practice with one big idea: two quantities are proportional when their ratios stay equal. That sounds simple, but the standard behind it asks a lot. Students have to recognize proportionality in tables, graphs, equations, and plain-language descriptions, then move between those formats without losing the thread. A good worksheet set builds that flexibility one representation at a time.
If you teach seventh grade math, you already know this unit sits at the center of the ratios and proportional relationships domain. The worksheets on this page target the four connected sub-skills inside CCSS 7.RP.A.2, so students practice testing for proportionality, finding the constant of proportionality, writing equations, and reading graph points. Grouping the practice this way keeps each sheet focused instead of dumping every skill onto one page.
Testing Whether a Relationship Is Proportional
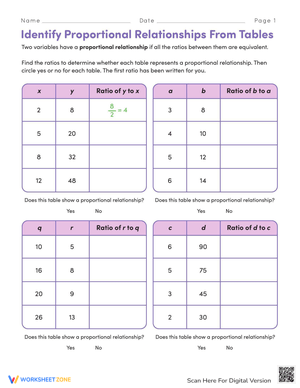
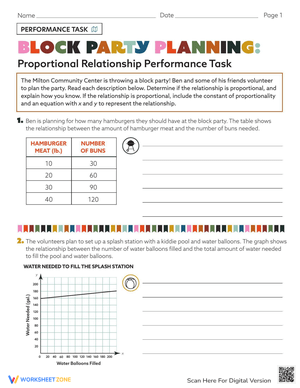
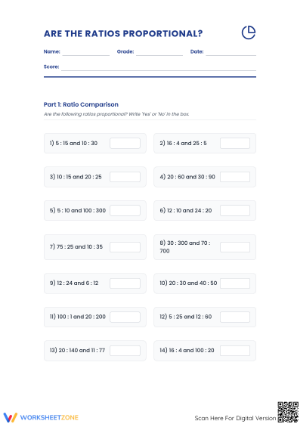
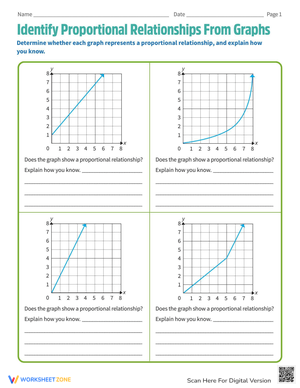
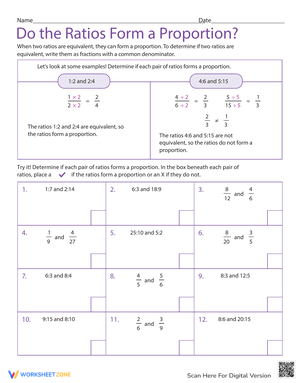
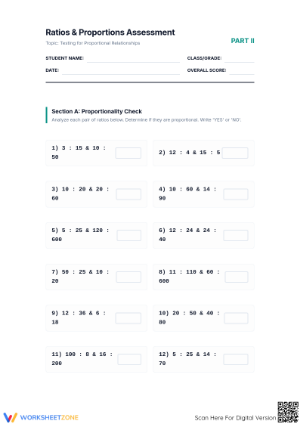
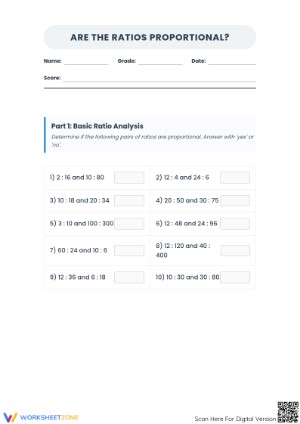
The first skill students need is deciding whether a relationship is proportional at all. In a table, that means checking whether every pair of values shares the same ratio. On a graph, it means asking one question: is this a straight line that passes through the origin? Worksheets that place a proportional table next to a non-proportional one force students to test rather than guess.
The origin is where most errors hide. A line can look straight and still fail the test if it crosses the y-axis above zero, and students who only memorized "straight line means proportional" miss it every time. Tell classes to trace the line back toward (0,0); if it lands anywhere else, the relationship has a starting value and is not proportional. Worksheets that include near-miss graphs, with a small y-intercept, expose that gap far better than clean textbook examples.
Timing matters here too. Spending the first two or three days of the unit only on the yes-or-no question, is this proportional, pays off later. Students who firmly own that decision have an easier time with the constant of proportionality, because they already know a single number governs the whole relationship.
Finding the Constant of Proportionality
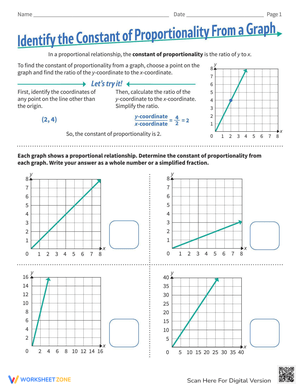
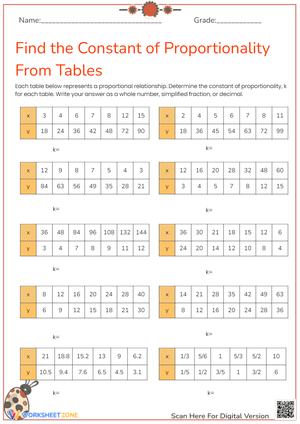
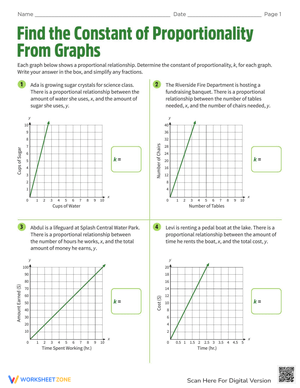
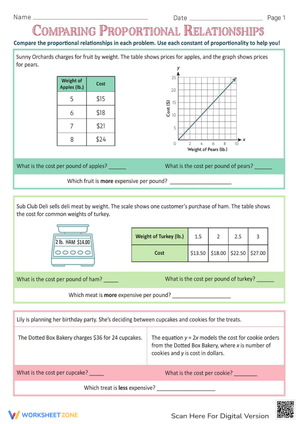
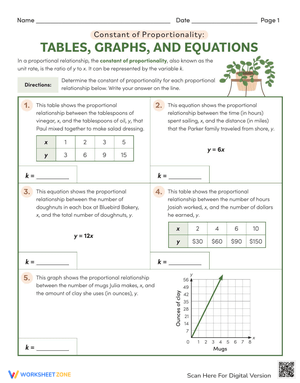
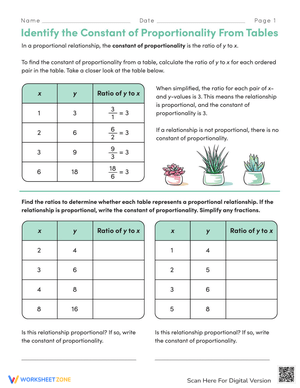
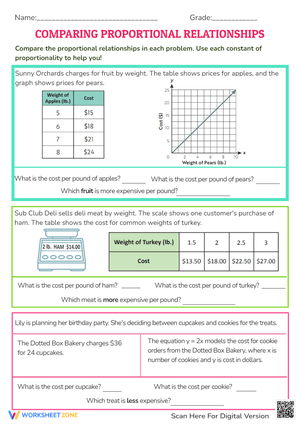
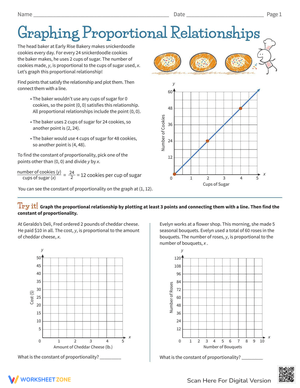
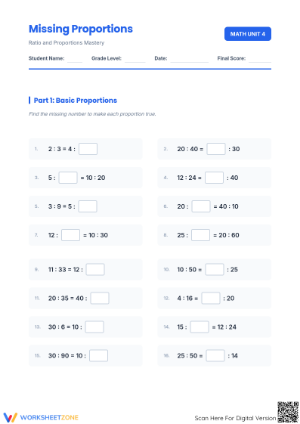
Once students confirm a relationship is proportional, the next job is finding its constant of proportionality. In a table they divide y by x. On a graph they find the value at x = 1. In an equation of the form y = kx, the constant is simply k. Strong worksheets ask students to find the same constant across all three formats so the number stops feeling like three different things.
According to the Common Core State Standards Initiative, standard 7.RP.A.2.b asks students to identify the constant of proportionality (unit rate) in tables, graphs, equations, diagrams, and verbal descriptions. That single sentence spans 5 representations, which is why worksheet practice needs to rotate through every one rather than stopping at tables.
This is also where the biggest vocabulary problem shows up. Students learn "unit rate" in sixth grade, then meet "constant of proportionality" in seventh, and often treat them as unrelated ideas. They are the same number. Worksheets that deliberately label the value both ways in the same problem help students weld the two terms together instead of storing them in separate mental folders.
Writing Equations from Proportional Relationships
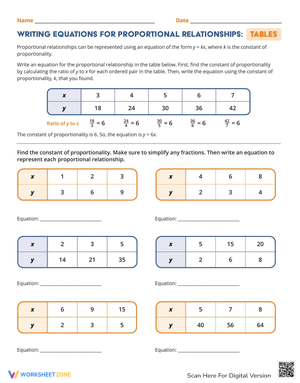
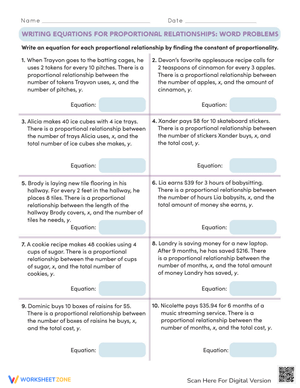
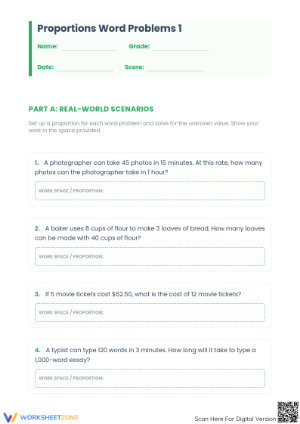
Equation writing is where proportional reasoning becomes a tool students can reuse. The standard uses the example t = pn, where total cost t is proportional to the number of items n at price p. Worksheets built around real contexts, such as unit pricing at the store, doubling a recipe, or reading a scale on a map, give students a reason to write y = kx instead of memorizing a template.
The move that trips students up is deciding which quantity is which. Practice sheets that ask students to write the equation and then predict a value they can check against the table give immediate feedback. If the equation produces the table, it is right; if not, students catch the error themselves before you ever grade it.
Interpreting Points on a Proportional Graph
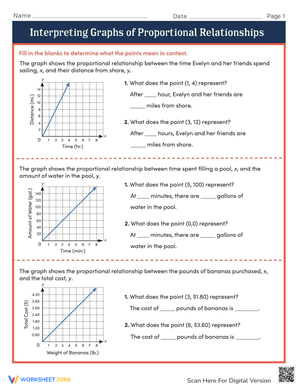
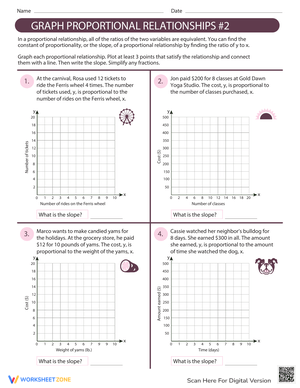
The last sub-skill is often the most tested and the least practiced: explaining what a specific point means. Students should be able to say that (0,0) means zero items cost zero dollars, and that the point (1, r) shows the unit rate directly. These are not throwaway questions. On end-of-unit assessments, "explain what this point represents" separates students who can compute from students who actually understand the relationship.
Worksheets that pair a graph with two or three points and ask for a written interpretation of each build the language students need. Ask for full sentences, not just coordinates, so the reasoning is visible. A student who writes "the point (1, 8) means one pound of apples costs eight dollars" has shown you both the math and the meaning, and that sentence is exactly what a test rubric rewards.
Common Mistakes These Worksheets Catch
A few predictable errors show up every year, and targeted reps catch them early. The first is assuming any line on a graph shows a proportional relationship. The second is finding the ratio of y divided by x in a table but flipping it to x divided by y, which produces the reciprocal of the true constant. The third is writing an equation with the constant in the wrong place, such as y = x + k instead of y = kx, which quietly turns a proportional relationship into a linear one that is not proportional.
When a worksheet mixes correct and incorrect student work and asks learners to find the error, it does double duty. Students practice the skill and rehearse the habit of checking their own reasoning. Error-analysis problems tend to stick because students remember the mistake better than a clean example.
Classroom Implementation
These worksheets flex across the parts of a seventh grade math block. For whole-class instruction, project one table-graph-equation set and work it together, narrating each representation change out loud. For small-group intervention, pull the students who consistently mislabel proportional versus non-proportional graphs and give them a sorting sheet of near-miss examples. That group usually needs the origin test more than anything else.
For quick formative checks, a half-page exit ticket with one table and one graph tells you in two minutes who can test for proportionality. Maneuvering the Middle suggests anchoring proportional reasoning in concrete contexts before pushing to abstract equations, and a warm-up that starts with a price or a recipe gives every student an entry point. Rotate the representation you assess each day so no student can lean on a single method.
For enrichment, hand early finishers a blank table and ask them to invent a proportional relationship, graph it, and write its equation. Building the relationship from scratch is harder than reading one, and it surfaces misconceptions you can address the next day.
Frequently Asked Questions
1. What grade level are proportional relationship worksheets designed for?
These worksheets target grade 7, where CCSS 7.RP.A.2 introduces recognizing and representing proportional relationships. They also work for grade 8 review or for advanced sixth graders who have already mastered unit rate and are ready to connect it to graphs and equations.
2. How do you tell if a table or graph shows a proportional relationship?
In a table, check whether every y-to-x ratio is equal; if one pair differs, the relationship is not proportional. On a graph, look for a straight line that passes through the origin. A straight line that crosses the y-axis above or below zero is not proportional.
3. What is the difference between constant of proportionality and unit rate?
They are the same value. Unit rate is the sixth-grade name; constant of proportionality is the seventh-grade name and the k in y = kx. Worksheets that label the number both ways help students connect the terms instead of learning them as separate concepts.
4. How can teachers use these worksheets for small-group intervention?
Pull students who confuse proportional and non-proportional graphs and give them sorting practice focused on the origin test. Keep the numbers simple so the reasoning, not the arithmetic, stays front and center. Short, targeted sets beat long mixed sheets for reteaching.
5. What real-world examples work best for teaching proportional equations like t = pn?
Unit pricing, recipe scaling, and map or model scale all give students a concrete reason to write y = kx. Start with a context students recognize, build the table, then let the equation fall out of the pattern they already see.













 Interactive Worksheet Maker
 Quiz Maker
 Word Search Maker
 Crossword Puzzle Maker
 Word Scramble Generator
 Sentence Scramble Generator
 Handwriting Worksheet Generator
 Name Tracing Generator
 Fill In The Blank Generator