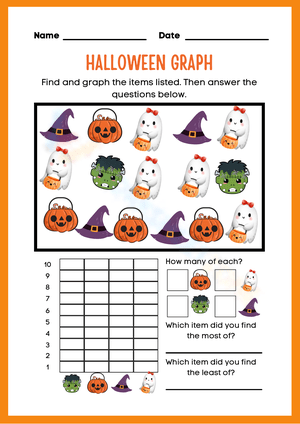
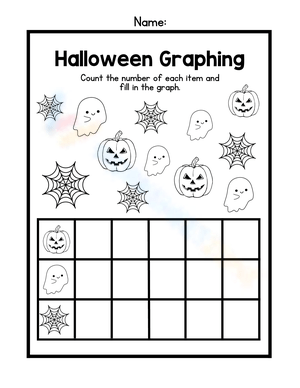
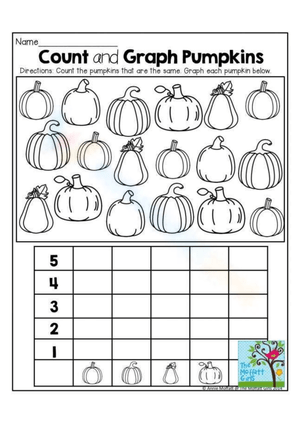
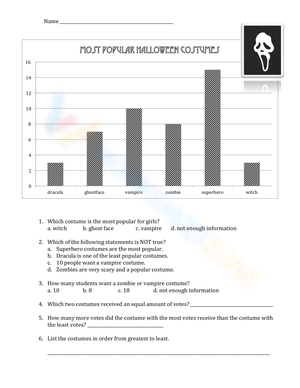
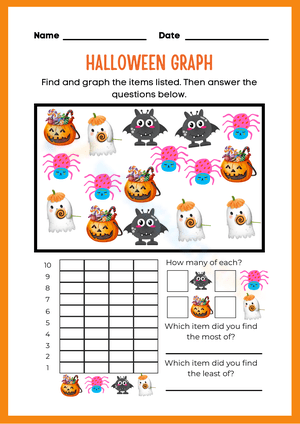
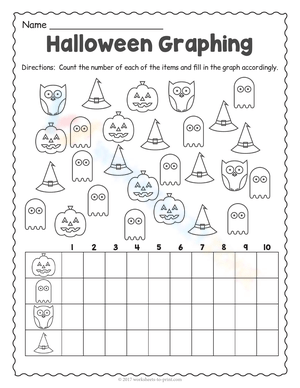
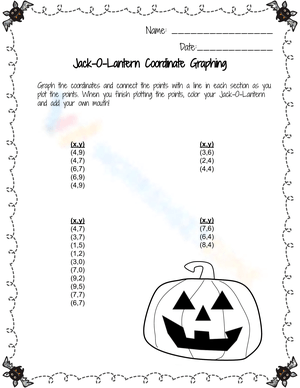
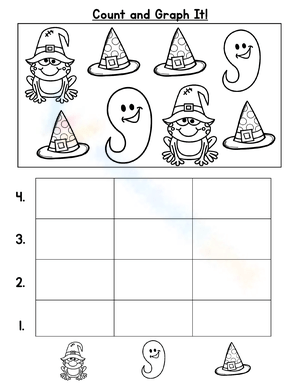
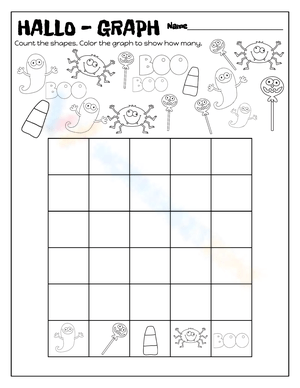
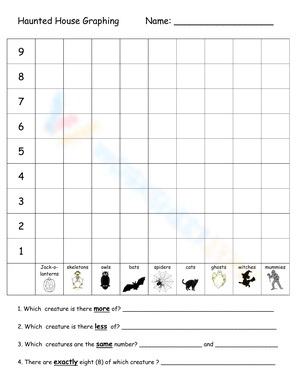
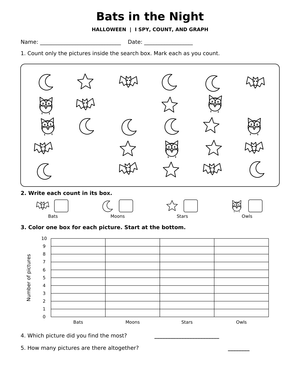
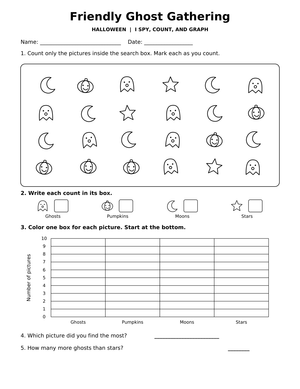
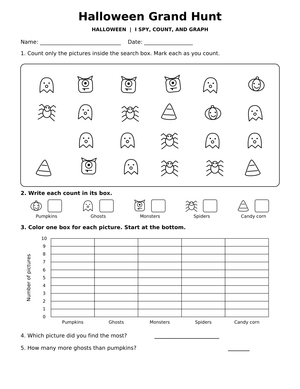
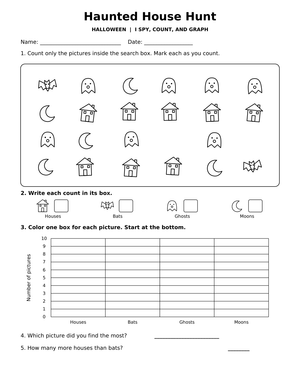
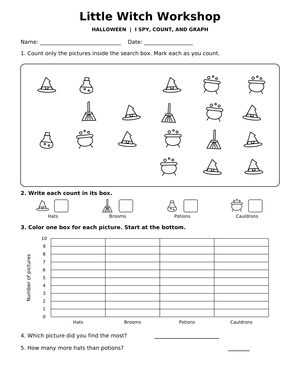
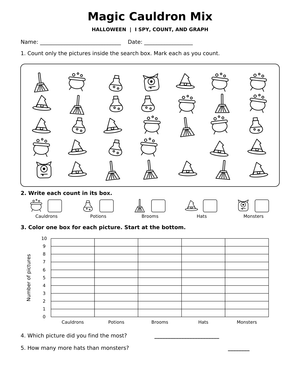
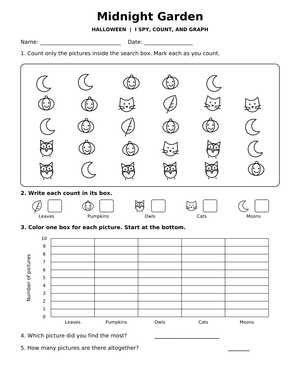
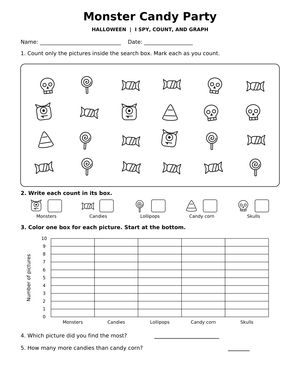
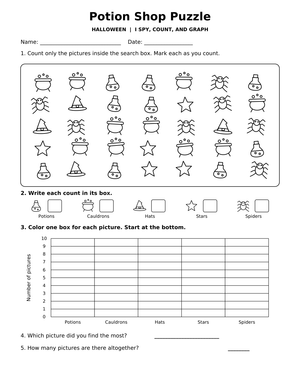
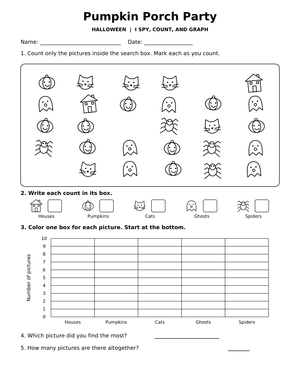
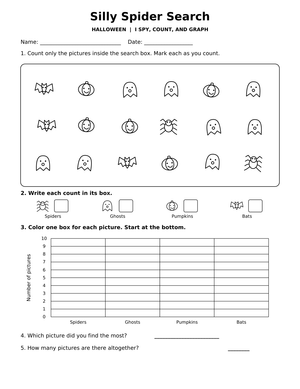
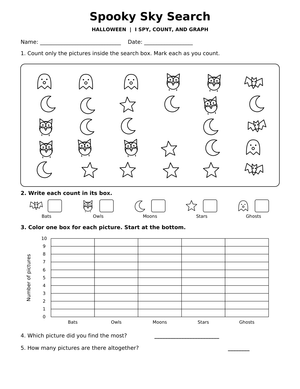
A well-built Halloween graphing set moves smoothly from one grade level to the next, building on skills students already have. In Kindergarten, students classify objects into categories, count the objects in each category, and sort the categories by count. By Grade 1, students organize and represent data with up to three categories using picture graphs and bar graphs. Grade 2 raises the ceiling to four categories, and Grade 3 introduces scale—where one symbol or grid line can represent 2, 5, or 10.
Here's the key detail that matters for worksheet selection: the jump from Grade 2 to Grade 3 is not about adding more categories, it's about changing the scale. A Grade 2 worksheet keeps graphs at a single-unit scale for up to four categories, while a Grade 3 version shifts to scaled picture graphs and scaled bar graphs. A Halloween worksheet that looks nearly identical on the surface can sit at very different grade levels depending on whether each pumpkin icon stands for one vote or five.
Using a Halloween Survey as Formative Assessment
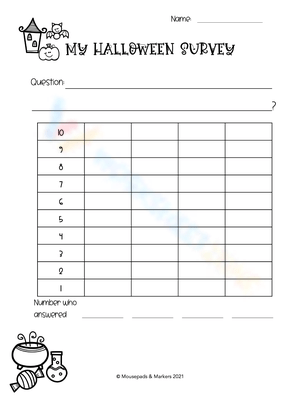
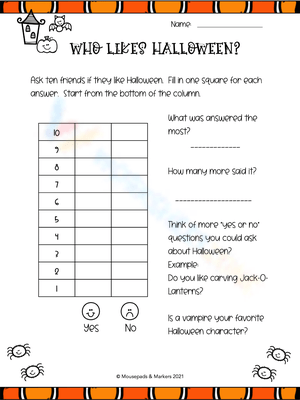
A quick class survey is one of the fastest ways to check whether students can actually read a graph, not just make one. Ask the room a single Halloween question, such as favorite treat or costume type, tally the votes, and have students graph the class data on the worksheet. Because they helped generate the numbers, they're invested in reading them correctly.
The interpretation questions then become a low-stakes check. If a student can build the bar graph but stumbles on how many more students chose candy corn than chocolate, you've found a specific gap in comparison reasoning rather than a general sense that graphing is hard. That precision is what makes seasonal data collection more than a party activity. It becomes a window into what students know and what they still need to practice.
Frequently Asked Questions
1. What grade levels are Halloween graphing worksheets appropriate for?
They fit K-3 best. Kindergarten students sort and count categories, Grade 1 and Grade 2 students build single-unit picture and bar graphs with up to four categories, and Grade 3 students work with scaled graphs and multi-step comparison questions. The same Halloween theme stretches across all four levels.
2. Can I use the same Halloween graphing worksheet with different grade levels?
Yes. Change the graph format while keeping the Halloween context identical. Offer a sorting page, a three-category picture graph, a four-category bar graph, and a scaled version of the same survey. Students feel like they share one activity while each group works at its own level.
3. How can Halloween graphing worksheets help with formative assessment?
Run a quick class survey, have students graph the data, and use the interpretation questions to spot exactly where reasoning breaks down. A student who can build the graph but struggles with comparison questions shows a specific gap rather than a general misunderstanding. That clarity lets you target small-group work precisely.
4. What should I look for in a Halloween graphing worksheet?
Look for pages that include both graph-building and interpretation questions. A worksheet that only asks students to fill in bars or color squares misses the chance to check for actual data reading. The questions about how many more, how many fewer, and which category came first or had the most are where learning lives.












 Interactive Worksheet Maker
 Quiz Maker
 Word Search Maker
 Crossword Puzzle Maker
 Word Scramble Generator
 Sentence Scramble Generator
 Handwriting Worksheet Generator
 Name Tracing Generator
 Fill In The Blank Generator