


























Views
Downloads

Grade 1 Halloween Graphing — Printable No-Prep Worksheet
Paste this activity's link or code into your existing LMS (Google Classroom, Canvas, Teams, Schoology, Moodle, etc.).
Students can open and work on the activity right away, with no student login required.
You'll still be able to track student progress and results from your teacher account.
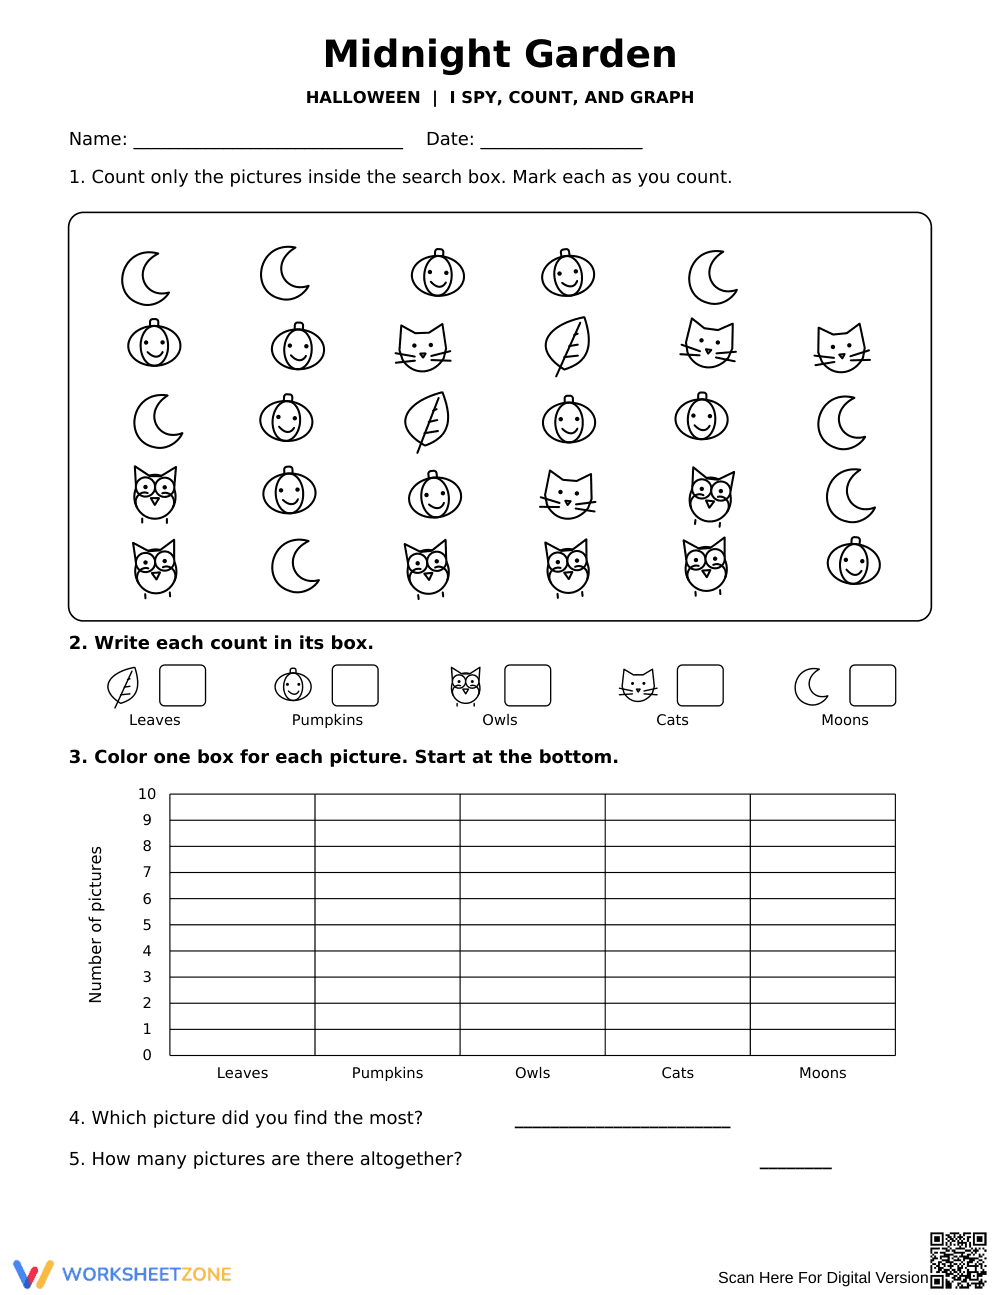
This Halloween-themed counting and graphing worksheet helps first-grade students practice collecting data and interpreting results. By finding hidden pictures, recording totals, and building a bar graph, young learners develop foundational math skills while answering simple analytical questions about their findings.
At a Glance
- Grade: 1 · Subject: Math
- Standard:
CCSS.MATH.CONTENT.1.MD.C.4— Organize, represent, and interpret data- Skill Focus: Counting and Graphing
- Format: 1 page · 5 problems · Answer key included · PDF
- Best For: Independent practice
- Time: 15–20 minutes
This single-page resource features an "I Spy" picture search with five Halloween categories. Students count each item, write the numerals, and color a bar graph to represent their data. The worksheet concludes with two questions requiring students to identify the most frequent item and calculate the total. An answer key is provided.
Designed for immediate classroom use, this activity requires virtually no teacher setup:
- Print (1 minute): Simply print the PDF worksheet and the accompanying answer key.
- Distribute (1 minute): Hand out the copies along with crayons or markers for the graphing section.
- Review (3 minutes): Use the provided answer key to quickly check student graphs and final calculations.
With under two minutes of total prep time, this resource is an excellent addition to any emergency sub plan or busy holiday week schedule.
This activity aligns to CCSS.MATH.CONTENT.1.MD.C.4: Organize, represent, and interpret data. While featuring five categories for extra counting practice, it perfectly targets core graphing skills required for first-grade math. Both standard codes can be copied directly into lesson plans, IEP goals, or district curriculum mapping tools.
Teachers can deploy this worksheet during independent math centers after a direct instruction lesson on bar graphs. It serves as an engaging, quiet activity that reinforces data visualization concepts. Alternatively, use it as a morning work assignment during the week of Halloween to get students focused and practicing core math skills right as they enter the classroom. As a formative assessment tip, observe whether students cross out or mark the pictures as they count them; this indicates their ability to track data accurately. Expect students to complete the entire page in 15 to 20 minutes.
This worksheet is ideal for first-grade students mastering basic data collection and representation. It also works well for advanced kindergarteners who need an extra challenge, or second graders requiring a quick review of graphing fundamentals. For students who struggle with tracking, encourage them to use a different colored crayon for each category of picture. Pair this activity with a whole-class anchor chart demonstrating how to build a bar graph from a simple tally chart.
Effectively teaching CCSS.MATH.CONTENT.1.MD.C.4 requires giving students hands-on opportunities to organize, represent, and interpret data in meaningful contexts. According to a recent EdReports 2024 analysis of elementary mathematics curricula, students who regularly engage with visual data representations, such as bar graphs and picture charts, demonstrate significantly higher proficiency in foundational problem-solving skills. By integrating counting tasks with immediate graphing applications, this worksheet bridges the gap between abstract numbers and concrete visual models. The structured progression from finding objects to plotting them on a grid helps solidify early mathematical reasoning. Providing targeted practice with these specific data interpretation tasks ensures that young learners build the necessary cognitive frameworks for more advanced statistical concepts in later grades, making this simple activity a highly effective tool for long-term mathematical success.


