




























Views
Downloads

Grade 1 Halloween Graphing — Printable No-Prep Worksheet

Paste this activity's link or code into your existing LMS (Google Classroom, Canvas, Teams, Schoology, Moodle, etc.).
Students can open and work on the activity right away, with no student login required.
You'll still be able to track student progress and results from your teacher account.
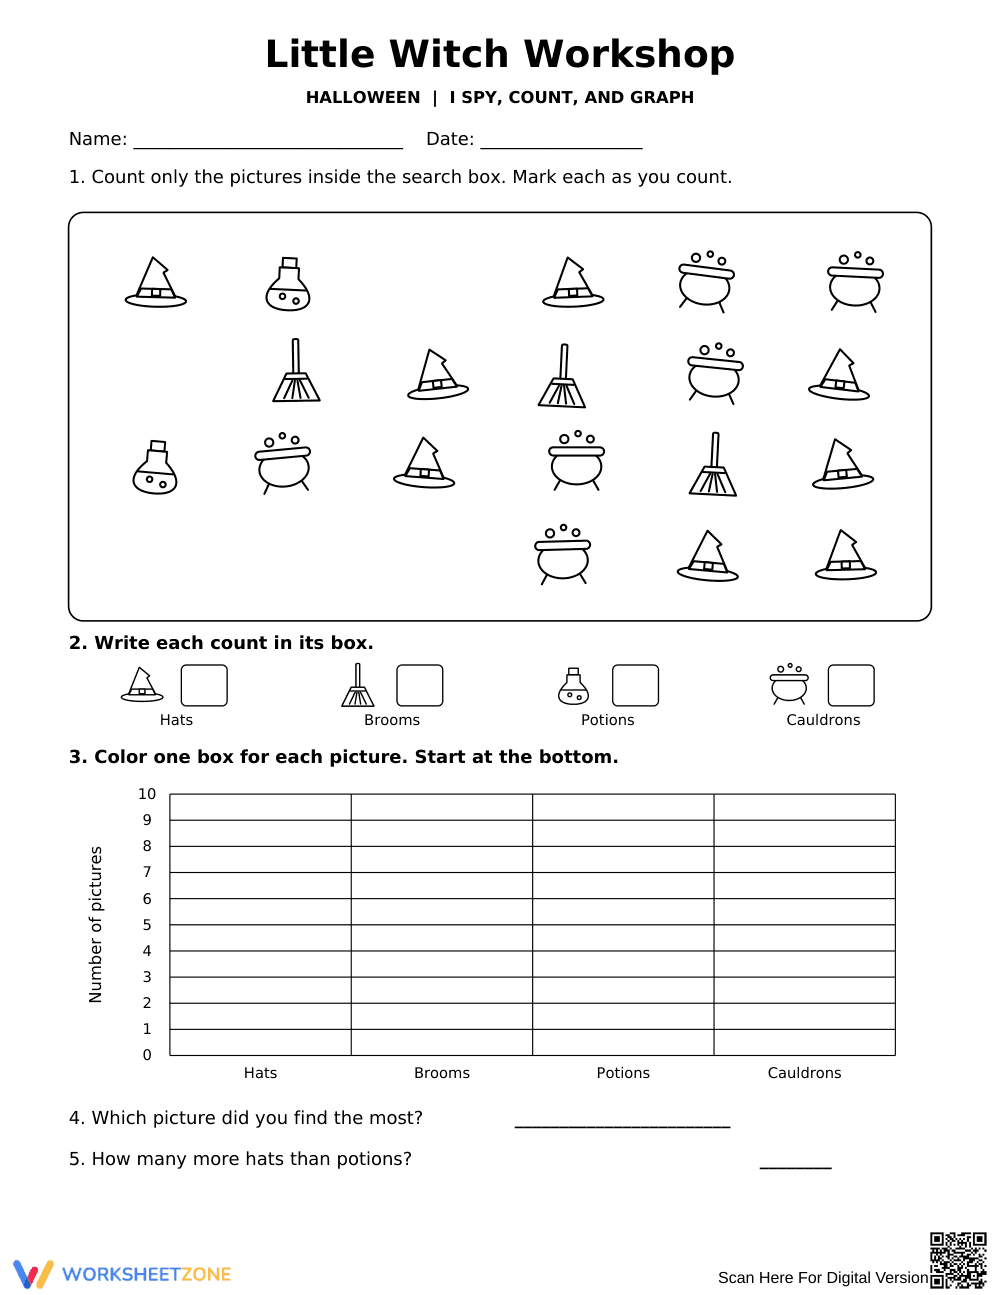
This Grade 1 Halloween math worksheet develops foundational data analysis skills through an engaging I Spy and graphing activity. Students search for themed workshop items, count and record totals, construct a vertical bar graph, and answer comparative questions to interpret categorical data with accuracy.
At a Glance
- Grade: 1 · Subject: Math
- Standard:
CCSS.MATH.CONTENT.1.MD.C.4— Organize, represent, and interpret data with up to four categories- Skill Focus: Counting, bar graphing, and comparative analysis
- Format: 1 page · 5 tasks · Answer key included · PDF
- Best For: Independent practice, centers, or sub plans
- Time: 15–20 minutes
What's Inside
The single-page printable features a five-part structured layout. Students search a visual field of witch hats, potion bottles, brooms, and cauldrons, record their counts, shade a 10-unit vertical bar graph, and solve two data interpretation problems. A matching answer key enables instant grading.
Zero-Prep Classroom Workflow
Teachers can implement this activity in under 2 minutes of prep:
- Print (30 seconds): Print the single-page PDF with no cutting or prep required.
- Distribute (30 seconds): Pass out sheets with pencils and crayons for immediate work.
- Review (1 minute): Use the visual answer key for swift grading or class review.
The clear layout makes this an ideal zero-prep emergency substitute plan.
Standards Alignment
This worksheet aligns directly with `CCSS.MATH.CONTENT.1.MD.C.4`, which requires Grade 1 students to organize, represent, and interpret data with multiple categories and answer comparative questions. It also supports `CCSS.MATH.CONTENT.1.OA.C.5` through counting and subtraction. Both standard codes can be copied directly into lesson plans, IEP goals, or district curriculum mapping tools.
How to Use It
Use this worksheet after direct instruction on bar graphs during October math blocks, or assign it to an independent center. Formatively assess students by watching whether they cross off items while counting to prevent recount errors. Expected completion time is 15 to 20 minutes.
Who It's For
This activity is designed for first graders building early graphing literacy and second graders needing review. Support fine motor learners by offering counters before shading. Pair this worksheet with a classroom anchor chart displaying bar graph labels.
According to research by Fisher & Frey (2014) on scaffolding and guided instruction, structured visual representations enable early elementary students to bridge concrete counting tasks with abstract data interpretation. The Little Witch Workshop worksheet operationalizes this pedagogy by aligning directly to standard CCSS.MATH.CONTENT.1.MD.C.4, guiding learners to organize, represent, and interpret data across four distinct categories. By progressing from an unstructured visual search field to numerical tallying and a standard vertical bar graph, students develop systematic data literacy skills. The closing analytical questions require learners to calculate comparative differences between quantities, establishing essential foundations for higher-level arithmetic, subtraction, and multi-step word problem solving. This single-page printable format provides educators with an actionable, evidence-based instructional resource that supports rigorous formative assessment, purposeful independent practice, and curriculum-aligned mathematics skill development in diverse Grade 1 classrooms.


