


























Views
Downloads
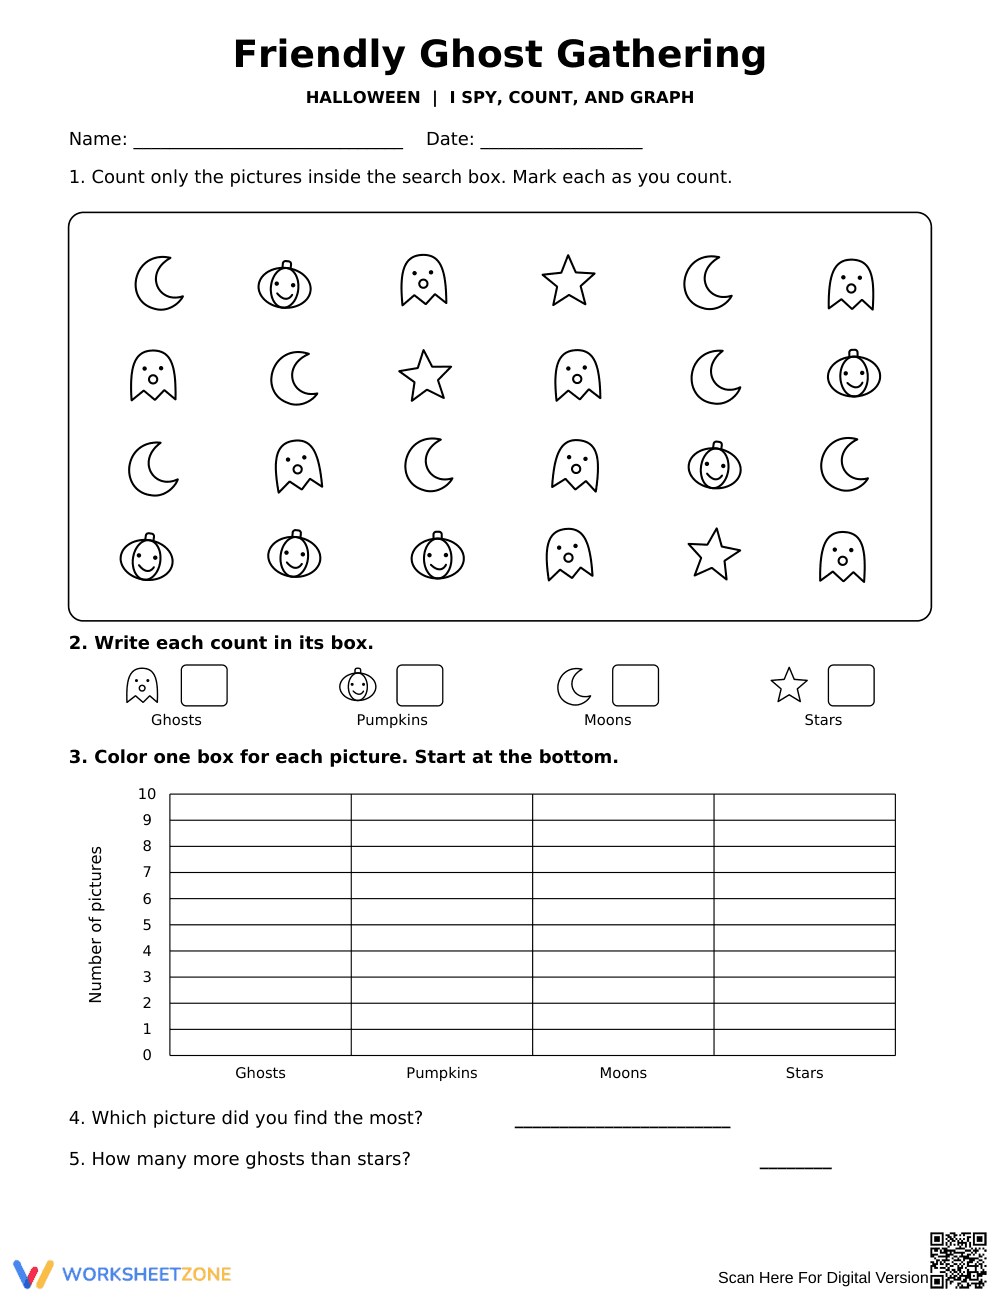

Grade 1 Halloween Graphing — Printable No-Prep Worksheet
Paste this activity's link or code into your existing LMS (Google Classroom, Canvas, Teams, Schoology, Moodle, etc.).
Students can open and work on the activity right away, with no student login required.
You'll still be able to track student progress and results from your teacher account.
This Grade 1 Halloween data worksheet gives early learners targeted practice in tallying, organizing, and graphing objects up to ten. Students scan a themed visual array, record category totals, fill in a vertical bar graph, and solve comparative questions using real visual data.
At a Glance
- Grade: 1 · Subject: Math
- Standard:
CCSS.MATH.CONTENT.1.MD.C.4— Organize, represent, and interpret data with up to three or four categories- Skill Focus: Counting items, coloring bar graphs, comparing quantities
- Format: 1 pages · 5 problems · Answer key included · PDF
- Best For: Independent math centers or seasonal morning work
- Time: 15–20 minutes
What's Inside
This one-page printable features an organized search box filled with friendly ghosts, smiling pumpkins, crescent moons, and stars. Below the search grid, learners write numeric totals across 4 discrete categories, complete a 10-tier vertical bar graph, and answer 2 comparative data analysis questions. A clear 1-page visual answer key is included for immediate feedback.
Zero-Prep Workflow
Teachers can integrate this activity smoothly into daily instructional routines:
- Print (30 seconds): Send the single-page black-and-white activity sheet straight to your copier with zero collation required.
- Distribute (15 seconds): Hand out the page alongside crayons or markers for simple coloring.
- Review (1 minute): Display the visual key on a document camera for quick peer or self-checking.
Total prep time remains under 2 minutes, making it an ideal resource for emergency sub plans, quick transitions, or seasonal math blocks.
Standards Alignment
Primary alignment: `CCSS.MATH.CONTENT.1.MD.C.4` — Organize, represent, and interpret data with up to three categories; ask and answer questions about the total number of data points, how many in each category, and how many more or less are in one category than in another. Supporting alignment includes `CCSS.MATH.CONTENT.K.MD.B.3` for sorting categories by count. Both standard codes can be copied directly into lesson plans, IEP goals, or district curriculum mapping tools.
How to Use It
Use this activity directly after whole-group direct instruction on picture and bar graphs to solidify sorting skills. It also functions well during small-group guided intervention. Watch students as they count: encourage them to cross off icons inside the search frame to prevent repeat counting and assess one-to-one correspondence. Completion time spans 15 to 20 minutes.
Who It's For
This activity is designed for first-grade students learning foundational data concepts, kindergarten students needing enrichment, or second graders requiring a quick seasonal review. Pair this worksheet naturally with concrete sorting counters or a classroom anchor chart illustrating horizontal and vertical graph axes.
According to EdReports 2024, foundational primary numeracy develops most reliably when visual representations bridge concrete object counting and abstract symbolic notation. This single-page resource directly addresses standard CCSS.MATH.CONTENT.1.MD.C.4 by structuring student interaction through three connected phases: systematic item counting, vertical bar shading, and answering targeted comparative questions such as finding the largest category and computing differences. Incorporating clean blackline icons allows young learners to practice visual tracking and fine-motor control simultaneously without extraneous cognitive load. When students mark each ghost, pumpkin, moon, and star as they count, they establish systematic data collection habits essential for early mathematical fluency. The structured graph format ensures students clearly conceptualize quantitative comparison, supporting both general education curriculums and targeted Tier 2 math intervention settings.


