



























Views
Downloads

Grade 1 Halloween Graphing — Printable Worksheet

Paste this activity's link or code into your existing LMS (Google Classroom, Canvas, Teams, Schoology, Moodle, etc.).
Students can open and work on the activity right away, with no student login required.
You'll still be able to track student progress and results from your teacher account.
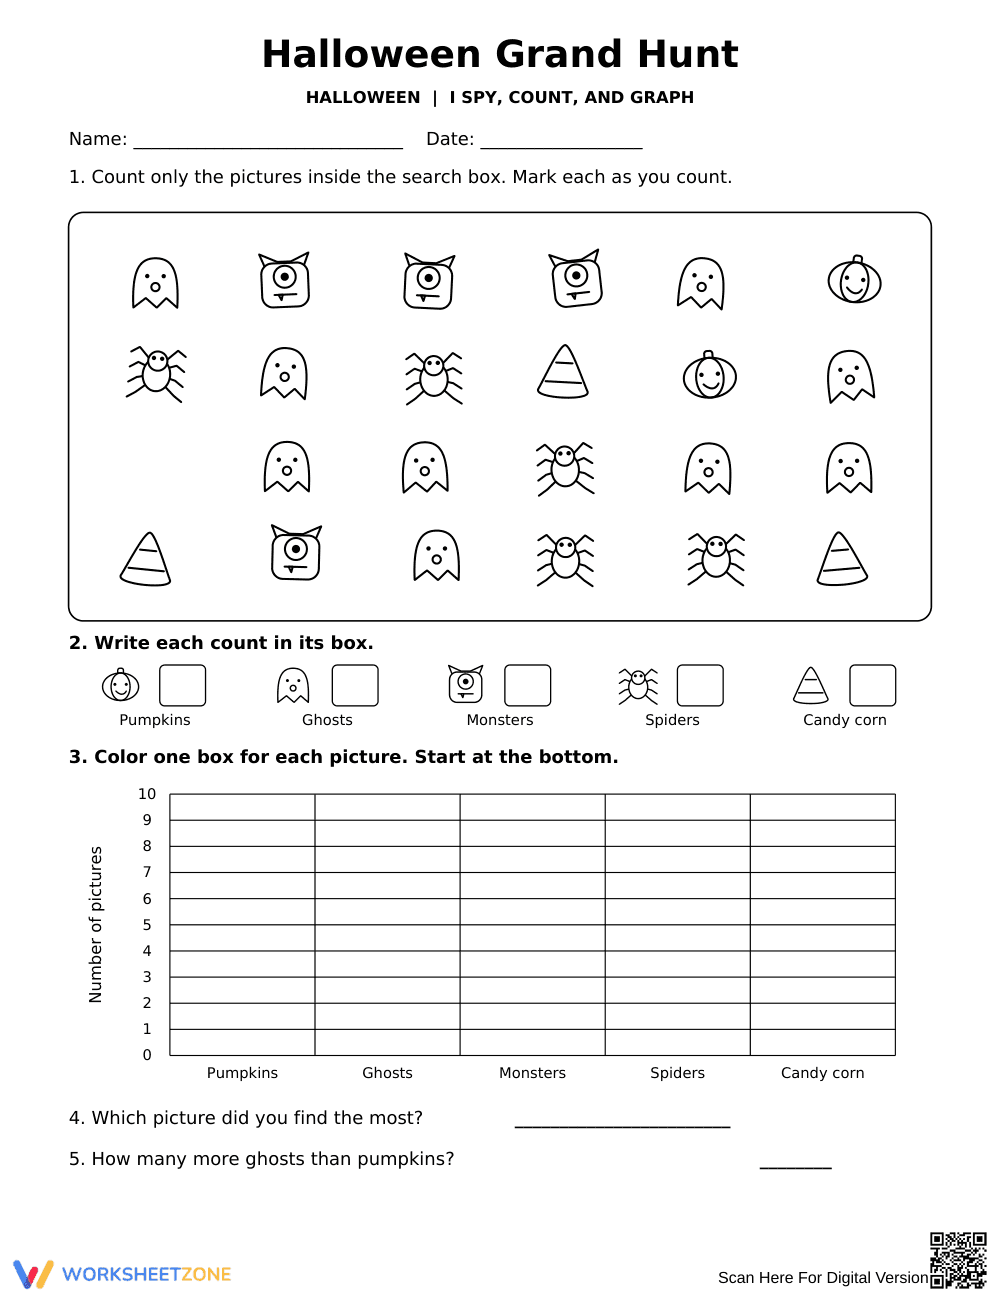
This Halloween math worksheet guides Grade 1 students through counting picture data, constructing a vertical bar graph, and answering comparative analysis questions. Students count five thematic icons, record tallies, shade graph bars up to ten, and calculate numerical differences between categories with complete visual support.
At a Glance
- Grade: 1 · Subject: Math
- Standard:
CCSS.MATH.CONTENT.1.MD.C.4— Organize, represent, and interpret data with multiple categories and compare totals- Skill Focus: Counting, graphing, and comparative data analysis
- Format: 1 pages · 5 problems · Answer key included · PDF
- Best For: October math centers and morning work
- Time: 15–20 minutes
What's Inside
The 1-page activity features a contained search box filled with five distinct Halloween icons: pumpkins, ghosts, monsters, spiders, and candy corn. Five structured tasks prompt learners to cross off items while counting, record totals into designated answer boxes, fill in a vertical bar graph numbered 0 to 10, determine the category with the highest frequency, and solve a two-category subtraction word problem. A complete visual answer key is provided for instant evaluation.
Zero-Prep Workflow
Educators can implement this resource in under 2 minutes of total prep time:
- Print (30 seconds): Send the single-page black-and-white PDF directly to the school copier without collation or staple requirements.
- Distribute (30 seconds): Hand out copies alongside crayons or pencils during morning arrival or math center transitions.
- Review (60 seconds): Project or reference the completed answer key for fast peer verification or whole-class review.
Its self-contained instructions also make it ideal for emergency substitute teacher plans.
Standards Alignment
This activity aligns to CCSS.MATH.CONTENT.1.MD.C.4: Organize, represent, and interpret data with up to three categories; ask and answer questions about the total number of data points, how many in each category, and how many more or less are in one category than in another. It also reinforces foundational counting within CCSS.MATH.CONTENT.K.CC.B.5. Both standard codes can be copied directly into lesson plans, IEP goals, or district curriculum mapping tools.
How to Use It
Use this worksheet after direct instruction on bar graphs as independent practice or within seasonal math rotations. A practical formative-assessment observation tip is to watch whether students mark off symbols in the search box systematically to avoid duplicate counting. Expect students to finish the 5 tasks in 15 to 20 minutes.
Who It's For
Designed for first-grade general education classrooms, this resource supports visual learners and English language learners through distinct, high-contrast line art. Pair it with a classroom anchor chart displaying vertical bar graph components or hands-on counting cubes for students requiring physical manipulatives.


