




























Views
Downloads

Grade 1 Halloween Graphing — Printable No-Prep Worksheet

Paste this activity's link or code into your existing LMS (Google Classroom, Canvas, Teams, Schoology, Moodle, etc.).
Students can open and work on the activity right away, with no student login required.
You'll still be able to track student progress and results from your teacher account.
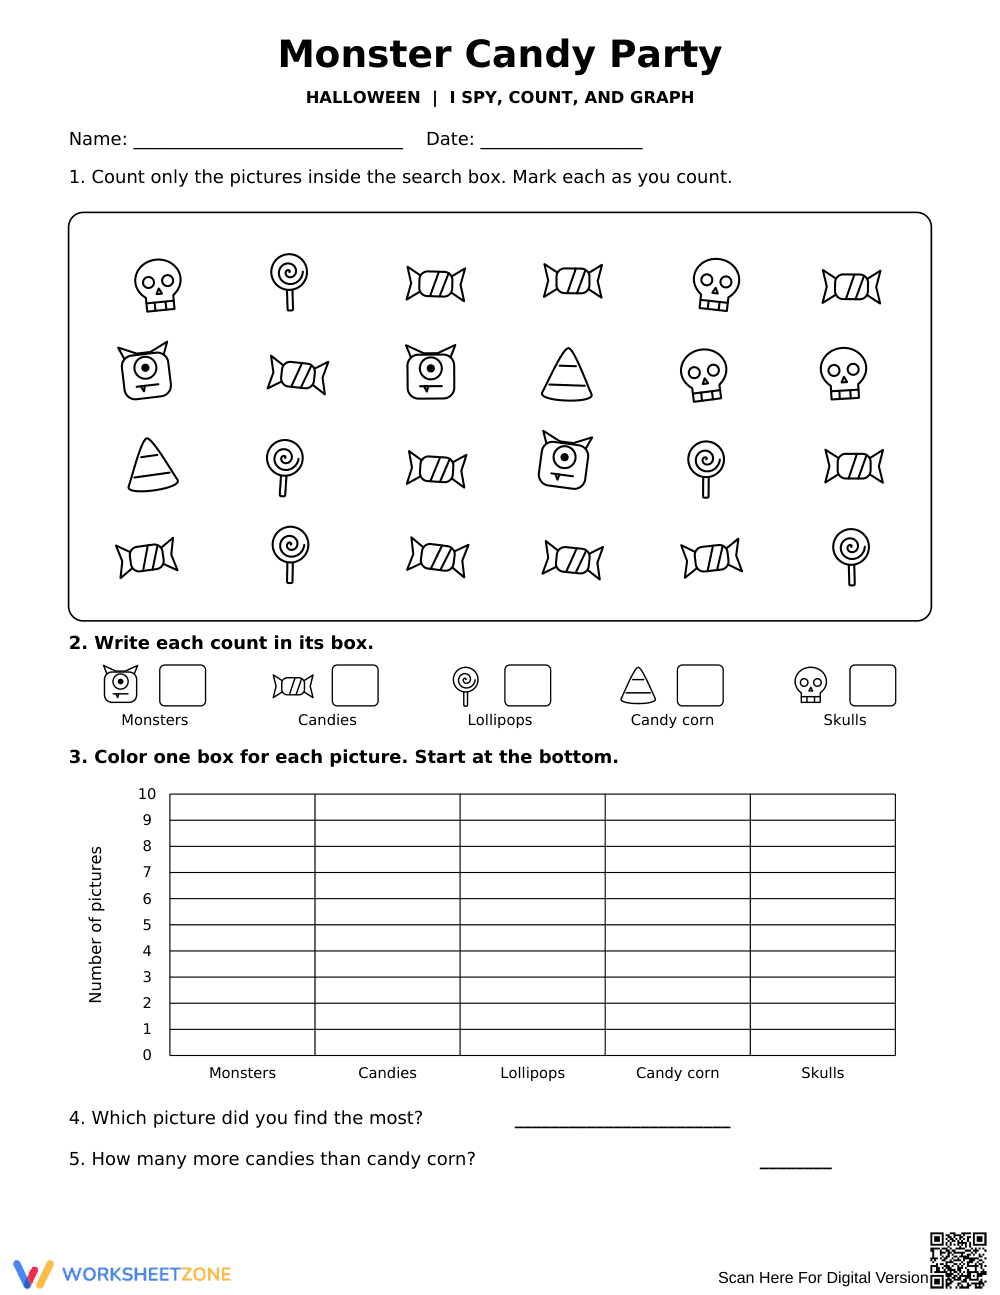
This Grade 1 math worksheet gives students engaging practice with counting, data organization, and basic bar graphs. By searching for Halloween-themed images and plotting their findings, young learners build foundational data interpretation skills while answering simple comparison questions to solidify their mathematical reasoning.
At a Glance
- Grade: 1 · Subject: Math
- Standard:
CCSS.MATH.CONTENT.1.MD.C.4— Organize, represent, and interpret data to answer questions- Skill Focus: Counting and Graphing
- Format: 1 page · 5 tasks · Answer key included · PDF
- Best For: Independent practice or morning work
- Time: 15–20 minutes
Inside this single-page resource, students find an "I Spy" search box with five Halloween items. They count each item, write the total, and color a bar graph to represent their data. Finally, two comprehension questions ask students to identify the most frequent item and calculate the difference between two categories. An answer key is provided.
This resource is designed for a zero-prep workflow:
- Print (1 minute): Print the student worksheet and answer key.
- Distribute (1 minute): Hand out worksheets and crayons.
- Review (3 minutes): Use the visual key to check graphs and answers.
With under two minutes of teacher prep time, this activity is highly suitable for emergency sub plans.
This worksheet is aligned to CCSS.MATH.CONTENT.1.MD.C.4: Organize, represent, and interpret data with up to three categories; ask and answer questions about the total number of data points. Both standard codes can be copied directly into lesson plans, IEP goals, or district curriculum mapping tools.
This graphing activity fits perfectly into a fall math center. Teachers can use it after direct instruction on bar graphs for hands-on practice, or as morning work. Formative assessment tip: watch how students track items—do they cross them out? This reveals their organizational strategies. Expected completion time is 15 to 20 minutes.
Designed for first-grade students mastering early data concepts, this can also review second-grade skills. For differentiation, struggling students can use physical manipulatives to cover images before counting. This pairs naturally with an anchor chart on reading bar graphs.
Developing early data literacy is a critical component of elementary mathematics. By engaging with standard CCSS.MATH.CONTENT.1.MD.C.4, students learn to organize, represent, and interpret data to answer questions, which forms the basis for more complex statistical reasoning in later grades. According to a 2024 report by EdReports, integrating visual models like bar graphs with concrete counting tasks significantly improves young learners' ability to comprehend quantitative relationships. When students actively search, tally, and graph their own data sets, they bridge the gap between abstract numbers and physical quantities. This foundational practice not only reinforces basic arithmetic but also encourages analytical thinking when comparing different categories. Providing structured, thematic activities ensures that students remain engaged while mastering these essential mathematical competencies, setting a strong trajectory for future STEM learning.


