



























Views
Downloads

Grade 1 Graphing — Printable No-Prep Worksheet

Paste this activity's link or code into your existing LMS (Google Classroom, Canvas, Teams, Schoology, Moodle, etc.).
Students can open and work on the activity right away, with no student login required.
You'll still be able to track student progress and results from your teacher account.
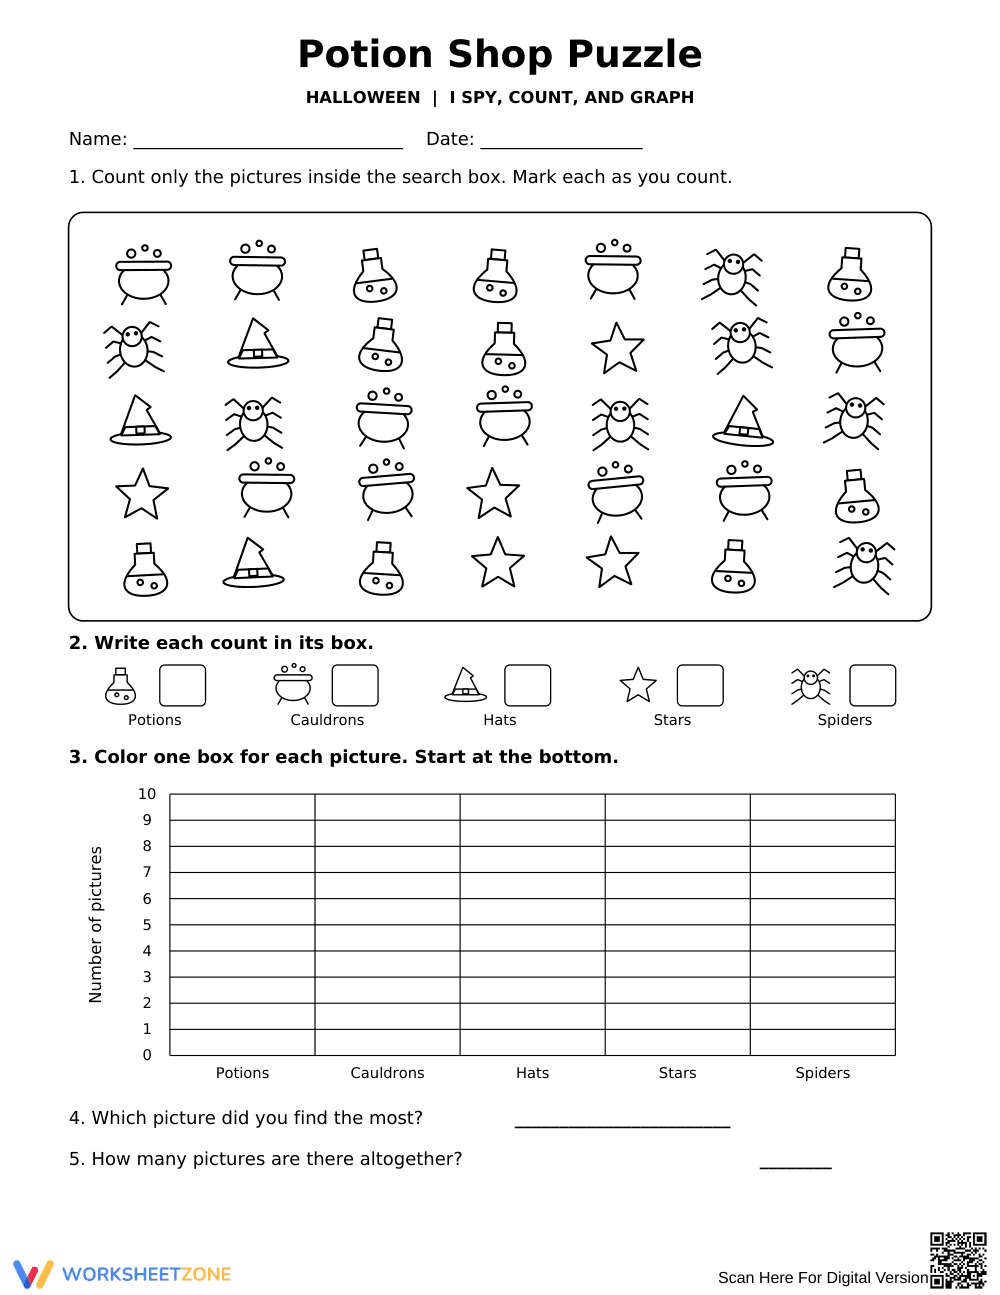
This Halloween math worksheet strengthens first-grade data literacy through an engaging I Spy and graphing activity. Students count five potion shop items, record frequencies, color a vertical bar graph, and interpret total sums. The structured page enables students to transition from counting objects to graphing data independently.
At a Glance
- Grade: 1 · Subject: Math
- Standard:
CCSS.MATH.CONTENT.1.MD.C.4— Organize, represent, and interpret data with categories and answer questions about totals- Skill Focus: Counting and bar graphing
- Format: 1 page · 5 tasks · Answer key included · PDF
- Best For: October math centers or morning work
- Time: 15–20 minutes
What's Inside
This single-page visual activity contains thirty-five Halloween pictures arranged in a clean search box. Learners count potions, cauldrons, hats, stars, and spiders, record values in five category boxes, and fill a bar graph scaled from zero to ten. Two final questions prompt analysis of category maximums and grand totals. A complete answer key is included.
Zero-Prep Workflow
This worksheet requires under two minutes of total teacher preparation:
- Print (30 seconds): Copy the black-and-white page directly without resizing or special margins.
- Distribute (30 seconds): Hand out copies with pencils and coloring supplies.
- Review (60 seconds): Display the answer key for instant self-grading.
Its self-explanatory visual format makes it ideal for emergency substitute teacher plans.
Standards Alignment
This resource aligns to `CCSS.MATH.CONTENT.1.MD.C.4` by having students organize, represent, and interpret categorical data. It also reinforces counting with `CCSS.MATH.CONTENT.1.OA.C.5`. Both standard codes can be copied directly into lesson plans, IEP goals, or district curriculum mapping tools.
How to Use It
Deploy this worksheet after direct instruction on bar graphs or in an October math station. During work time, observe whether students cross off counted icons to verify accuracy. The activity requires approximately 15 to 20 minutes to complete.
Who It's For
This printable serves first-grade students learning data representation and kindergarteners ready for extension. Support emerging counters with colored highlighters. Pair this activity with a whole-group anchor chart demonstrating how to read vertical bar graph axes.
According to EdReports 2024, high-quality primary mathematics materials must integrate foundational counting with structured representational models to build enduring conceptual understanding. This printable Halloween activity targets CCSS.MATH.CONTENT.1.MD.C.4 by guiding young learners through counting, categorizing data, and constructing bar graphs from an illustrated visual search field. By translating concrete pictorial icons into symbolic numbers and shaded bars, students bridge early quantity recognition with formal data analysis. EdReports 2024 emphasizes that visual data tasks with single-unit scales strengthen proportional reasoning and prepare early learners for comparative problem-solving. Incorporating structured counting grids allows primary students to verify quantities independently, while summary questions demand synthesis of category maximums and comprehensive totals. The clean single-page format provides educators with an actionable diagnostic artifact that confirms student mastery of category sorting, graphic organization, and one-to-one correspondence in early elementary math curricula.


