




























Views
Downloads

Grade 1 Halloween Graphing — Printable No-Prep Worksheet

Paste this activity's link or code into your existing LMS (Google Classroom, Canvas, Teams, Schoology, Moodle, etc.).
Students can open and work on the activity right away, with no student login required.
You'll still be able to track student progress and results from your teacher account.
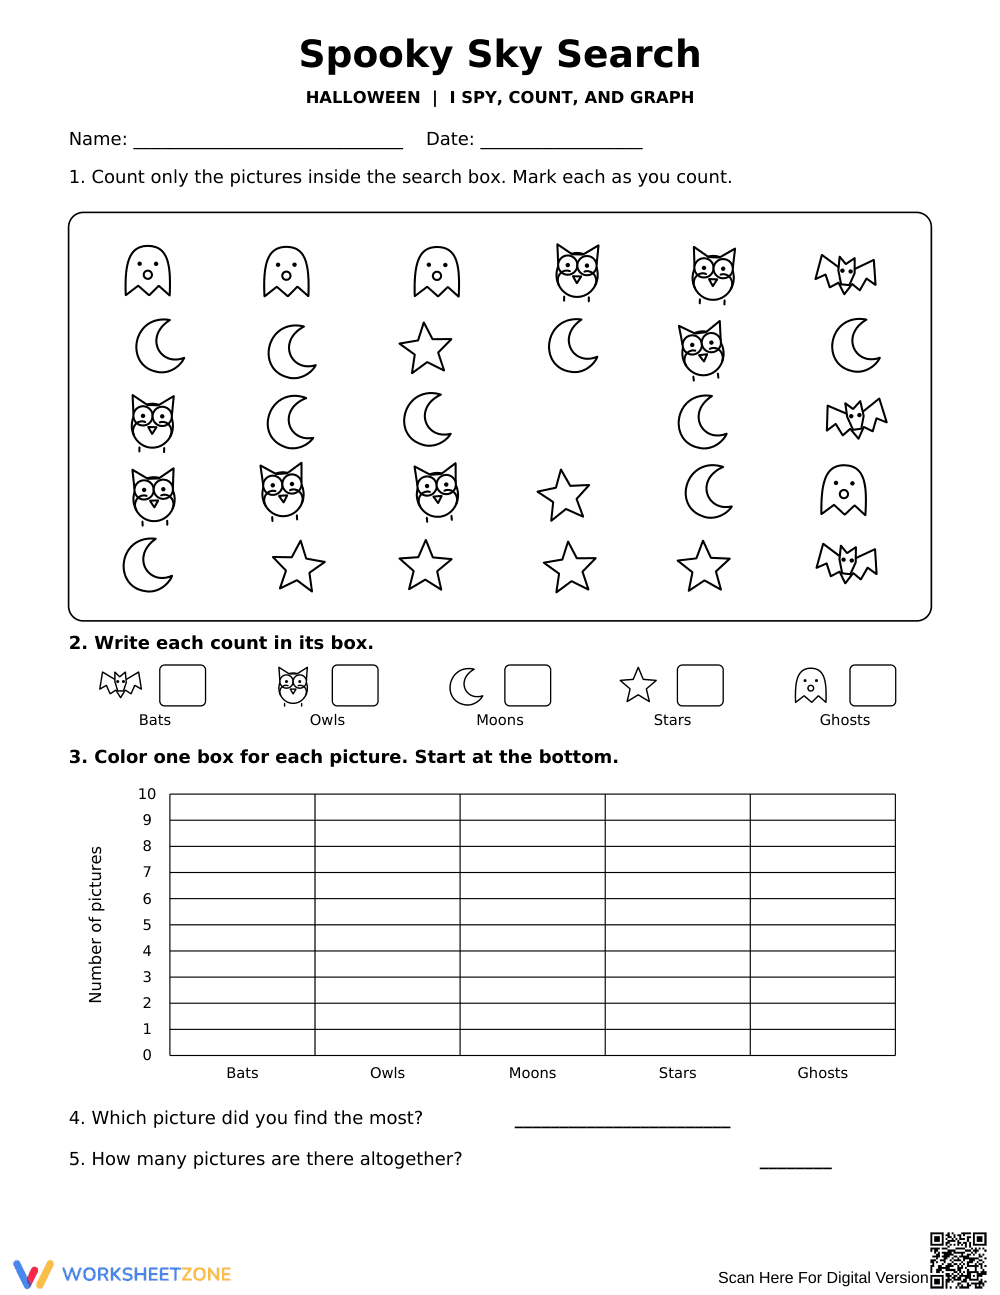
This Halloween-themed math worksheet gives Grade 1 students engaging practice with counting, data organization, and basic graphing. By searching for spooky shapes and recording their findings, learners build foundational data analysis skills while answering simple questions about quantities and totals.
At a Glance
- Grade: 1 · Subject: Math
- Standard:
CCSS.MATH.CONTENT.1.MD.C.4— Organize, represent, and interpret data- Skill Focus: Counting and Graphing
- Format: 1 page · 5 problems · Answer key included · PDF
- Best For: Independent practice or morning work
- Time: 15–20 minutes
What's Inside
This single-page resource features a fun "I Spy" style picture search containing five categories of Halloween images: bats, owls, moons, stars, and ghosts. Students count the items, write numerical totals in boxes, and color a bar graph to represent their data. Finally, they answer two comprehension questions to identify the most frequent image and calculate the total number of pictures. A complete answer key is provided.
Zero-Prep Workflow
This resource is designed for immediate classroom use with absolutely no teacher setup required.
- Print (1 minute): Print the student page and the accompanying answer key.
- Distribute (1 minute): Hand out the worksheet along with crayons or markers for the graphing section.
- Review (3 minutes): Use the visual answer key to quickly check student graphs and total counts.
With a total teacher prep time of under two minutes, this activity is highly suitable for emergency sub plans, math centers, or spontaneous independent work sessions.
Standards Alignment
This worksheet aligns directly with CCSS.MATH.CONTENT.1.MD.C.4: Organize, represent, and interpret data; ask and answer questions about the total number of data points, how many in each category, and how many more or less are in one category than in another. Both standard codes can be copied directly into lesson plans, IEP goals, or district curriculum mapping tools.
How to Use It
This graphing activity works perfectly as an independent math center during the Halloween season or as morning work before direct instruction begins. Students can typically complete the counting, graphing, and analysis steps within 15 to 20 minutes.
As a formative assessment observation tip, watch how students count the scattered images. Do they cross out or mark each picture as they count? If a student struggles with the final total, check if they are recounting the entire box or successfully adding the numbers they wrote in step two.
Who It's For
This worksheet is primarily designed for first-grade students mastering basic data representation. It also serves as excellent review for second graders or a guided challenge for advanced kindergarteners. For students who need extra support, encourage them to use a different colored crayon to cross out each specific shape as they count. This resource pairs naturally with a whole-class anchor chart on how to read and color bar graphs.
Early exposure to data organization builds critical logical reasoning skills. When students practice CCSS.MATH.CONTENT.1.MD.C.4, they learn to organize, represent, and interpret data visually. Translating scattered information into a structured bar graph helps young learners understand comparative quantities. According to a 2024 report by EdReports, foundational data literacy tasks in early elementary grades significantly improve students' ability to tackle complex statistical concepts later. By asking students to graph and analyze findings—identifying the most frequent item and calculating the total—this worksheet reinforces the connection between raw counting and meaningful data interpretation. Structured practice ensures abstract mathematical concepts remain accessible.


