


























Views
Downloads

Grade 2 Bar Graph — Printable No-Prep Worksheet
Paste this activity's link or code into your existing LMS (Google Classroom, Canvas, Teams, Schoology, Moodle, etc.).
Students can open and work on the activity right away, with no student login required.
You'll still be able to track student progress and results from your teacher account.
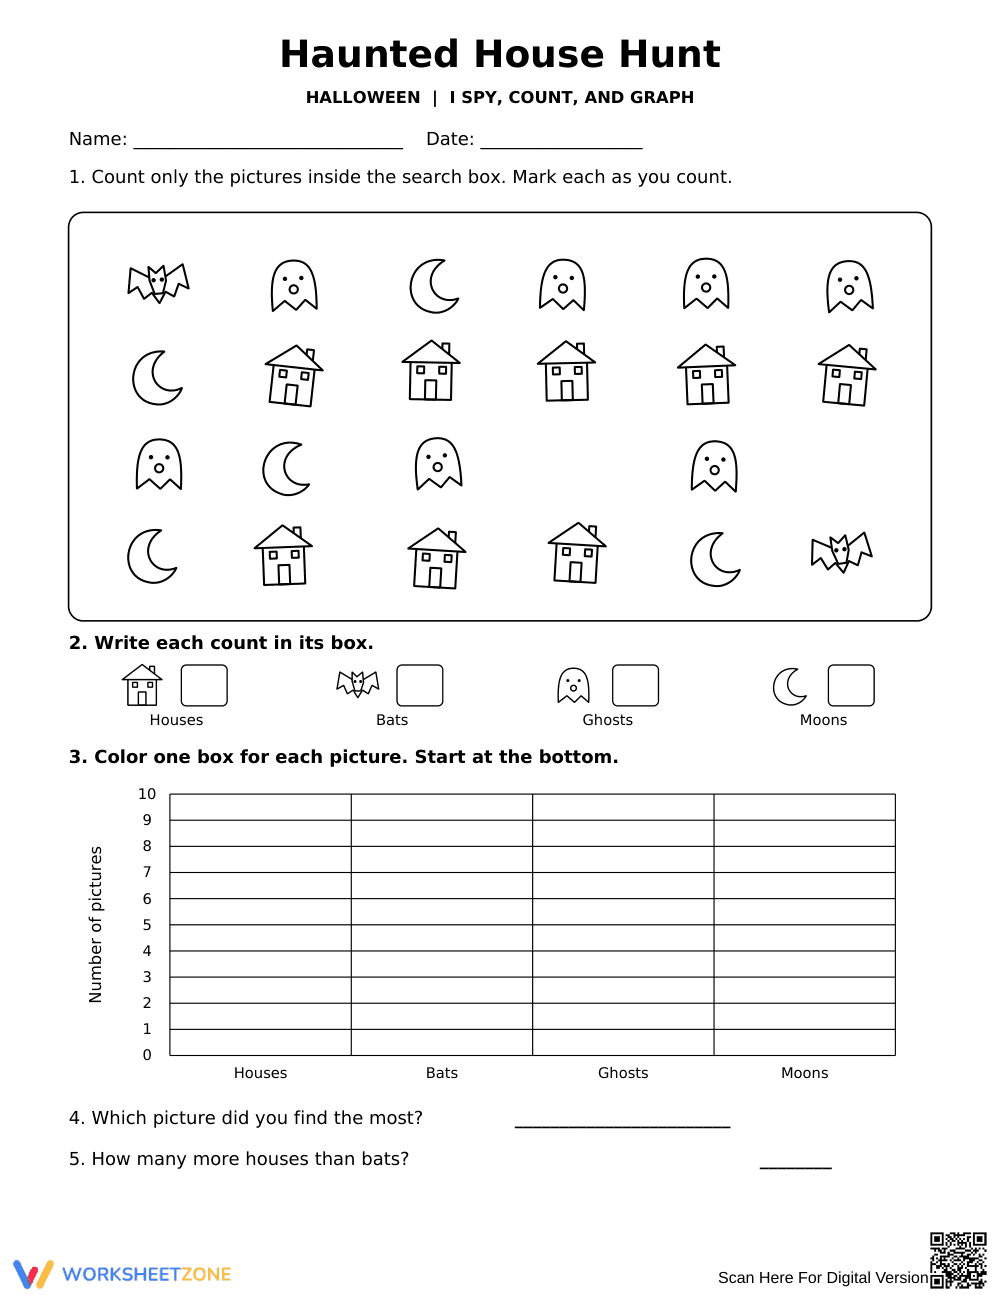
This Grade 2 Halloween math worksheet builds data literacy by guiding students to count, graph, and interpret themed sets. Learners tally four seasonal icons, construct a vertical bar graph with a single-unit scale, and answer comparative questions to determine category totals and differences.
At a Glance
- Grade: 2 · Subject: Mathematics
- Standard:
CCSS.MATH.CONTENT.2.MD.D.10— Draw a single-unit bar graph to represent data and solve comparative word problems.- Skill Focus: Categorical counting, vertical bar graphing, and data interpretation
- Format: 1 printable page · 5 structured problems · Full answer key included · PDF document
- Best For: Independent math practice or October seasonal stations
- Time: 15–20 minutes
What's Inside
This printable resource includes a single-page activity and a complete teacher answer key. Students explore a 22-item visual search box containing houses, bats, ghosts, and moons. Below the search area, four labeled boxes provide space to write totals. A 10-unit vertical grid provides structured graphing space, followed by two questions analyzing maximum values and category differences.
Zero-Prep Workflow
With a total preparation time under 2 minutes, this activity functions efficiently as an emergency sub plan or quick-turnaround assignment:
- Print (30 seconds): Send the single-page activity to your printer or copy machine without resizing or collation required.
- Distribute (30 seconds): Hand out the worksheet with standard pencils and crayons; instructions are self-explanatory.
- Review (60 seconds): Check student accuracy instantly against the visual answer key or display it for student self-correction.
Standards Alignment
This worksheet aligns to `CCSS.MATH.CONTENT.2.MD.D.10`: Draw a picture graph and a bar graph (with single-unit scale) to represent data with up to four categories, and solve simple compare problems using the graph. It also supports `CCSS.MATH.CONTENT.1.MD.C.4`. Both standard codes can be copied directly into lesson plans, IEP goals, or district curriculum mapping tools.
How to Use It
Use this activity after direct instruction on graphing conventions or as an engaging seasonal warm-up before small-group math rotations. During completion, observe whether students cross off counted objects systematically to prevent double-counting, which provides immediate formative assessment data on their organizational habits. Most second graders will complete all five sections in 15 to 20 minutes.
Who It's For
This sheet targets second-grade students learning bar graph construction, while providing first-grade enrichment or third-grade intervention. For learners needing support, offer highlighters to color-code icons before counting. Pair this worksheet with an anchor chart demonstrating how to align bar heights with axis numbers.
Designed to address CCSS.MATH.CONTENT.2.MD.D.10, this Halloween-themed mathematics resource guides early elementary learners to master data representation by tallying objects, plotting bar graphs, and answering comparative questions. Students count four distinct visual categories, shade matching columns on a 1-to-10 scale, and compute numerical differences between categories. According to findings highlighted in the RAND AIRS 2024 report, high-quality supplemental mathematics materials that integrate structured visual representations and systematic tracking routines foster significantly stronger foundational numeracy retention among early learners. By combining discrete counting tasks with direct data transfer into a standardized vertical graph, this activity bridges concrete item identification and abstract mathematical comparison. Teachers can efficiently deploy the single-page format for independent practice, formative assessment, or targeted intervention, ensuring that second-grade students build essential fluency in organizing, graphing, and analyzing categorical datasets aligned with rigorous national standards.


