




























Views
Downloads

Grade 1 Halloween Graphing — Printable No-Prep Worksheet

Paste this activity's link or code into your existing LMS (Google Classroom, Canvas, Teams, Schoology, Moodle, etc.).
Students can open and work on the activity right away, with no student login required.
You'll still be able to track student progress and results from your teacher account.
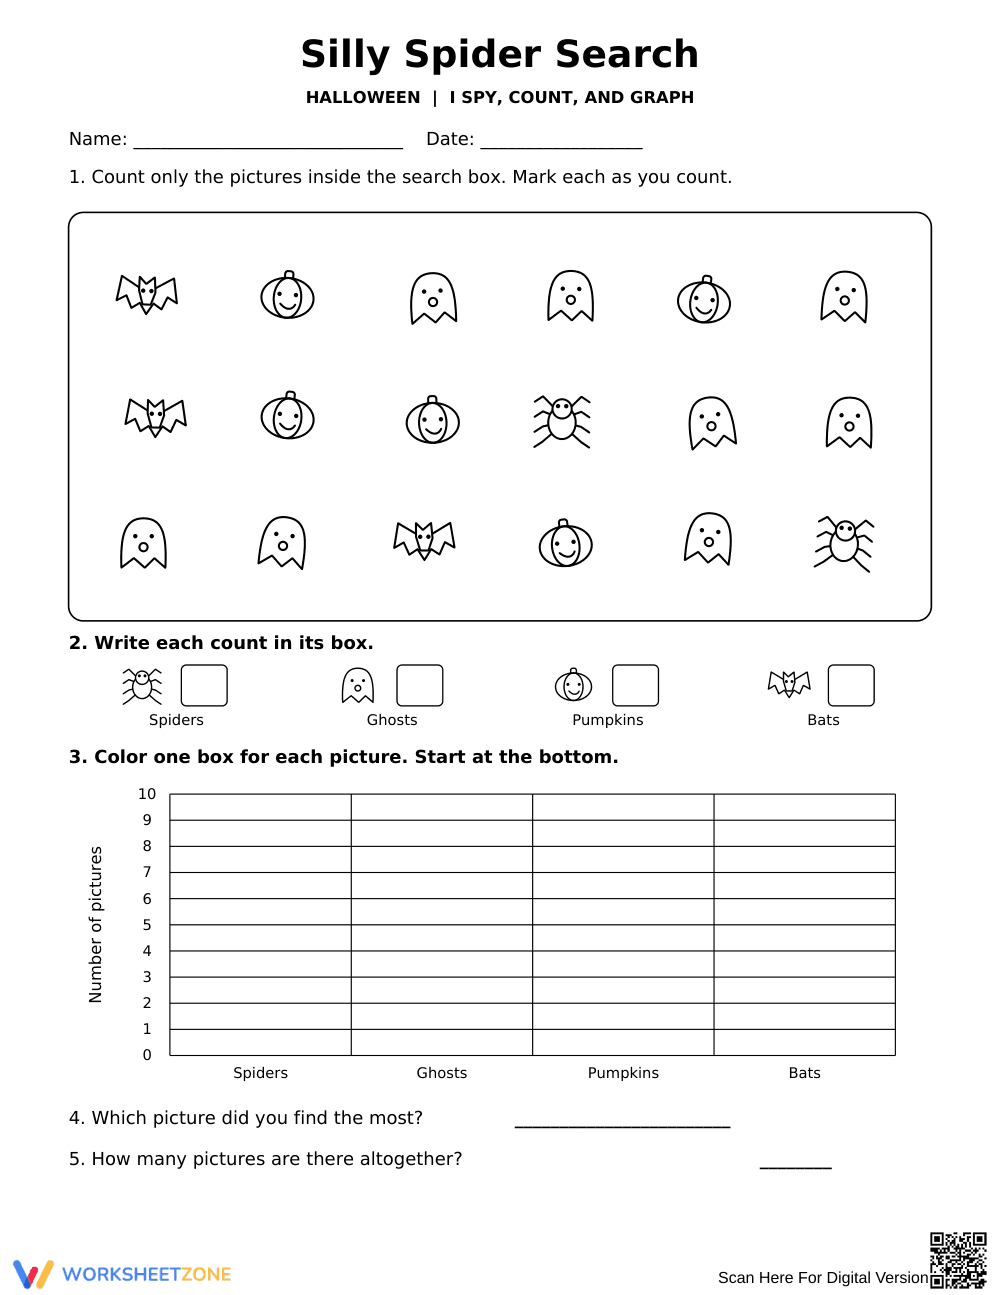
This Grade 1 math worksheet gives students engaging practice with counting and data representation using a fun Halloween theme. By finding and graphing spooky characters, young learners build foundational skills in organizing data and interpreting simple bar graphs to answer quantitative questions.
At a Glance
- Grade: 1 · Subject: Math
- Standard:
CCSS.MATH.CONTENT.1.MD.C.4— Organize, represent, and interpret data- Skill Focus: Counting and Bar Graphs
- Format: 1 page · 5 problems · Answer key included · PDF
- Best For: Independent practice or morning work
- Time: 10–15 minutes
This single-page activity features a visual "I Spy" search box filled with 18 Halloween-themed images, including bats, pumpkins, ghosts, and spiders. Students complete five distinct tasks: counting the items, writing the totals, coloring a bar graph, identifying the most frequent item, and calculating the total number of pictures. A complete, visually matched answer key is provided for quick grading.
Zero-Prep Workflow
This resource is designed for immediate classroom use with absolutely no teacher setup required.
- Print (1 minute): Simply print the single-page PDF and the accompanying answer key.
- Distribute (1 minute): Hand out the worksheets along with crayons or markers for the graphing section.
- Review (3 minutes): Use the visual answer key to quickly check student graphs and numerical answers.
With a total teacher prep time of under two minutes, this activity is an excellent addition to any emergency sub plan or busy holiday week schedule.
Standards Alignment
This activity is directly aligned to CCSS.MATH.CONTENT.1.MD.C.4, requiring students to organize, represent, and interpret data with up to three or more categories. Students must also ask and answer questions about the total number of data points and compare category totals. Both standard codes can be copied directly into lesson plans, IEP goals, or district curriculum mapping tools.
How to Use It
This worksheet is highly versatile for primary classrooms. Use it as an independent morning work assignment during the week of Halloween to settle students into their math block. Alternatively, place it in a math center after direct instruction on bar graphs, allowing students to practice data collection independently. Teachers can use the final two questions as a quick formative assessment to observe if students understand how to read the graph they just created. Expected completion time is 10 to 15 minutes.
Who It's For
This resource is ideal for first-grade students mastering basic data representation. The visual nature of the "I Spy" activity provides natural differentiation for visual learners and English Language Learners who might struggle with word-heavy math problems. It pairs perfectly with a whole-class anchor chart on how to build a bar graph from the bottom up.
Research highlights the importance of integrating visual data representation early in elementary mathematics. According to EdReports 2024, instructional materials that connect basic counting directly to graphing help solidify students' understanding of quantity and comparative values. By practicing CCSS.MATH.CONTENT.1.MD.C.4, students learn to organize, represent, and interpret data in a structured, meaningful format. This specific skill bridges the gap between early childhood counting and the more complex statistical reasoning required in later elementary grades. When students physically color in the boxes on a bar graph, they build a concrete, tactile understanding of one-to-one correspondence and categorical comparison. This foundational practice ensures that young learners are fully prepared to analyze larger data sets, recognize patterns, and answer complex quantitative questions as they progress through their mathematical education.


