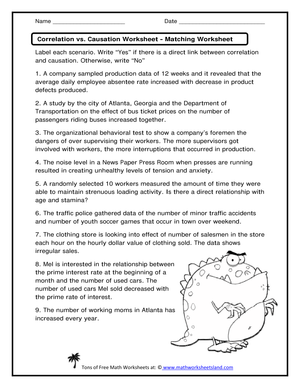
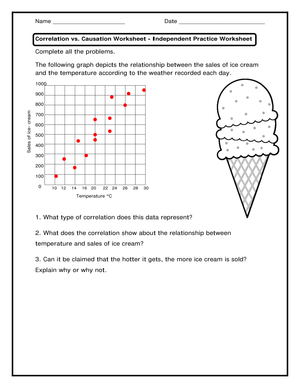
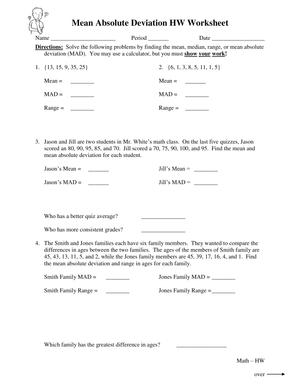
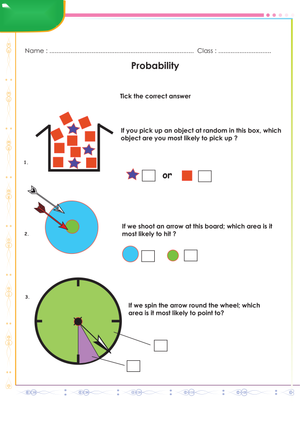
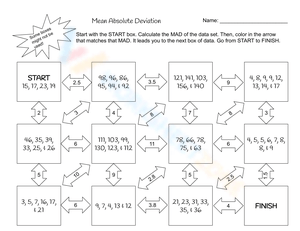
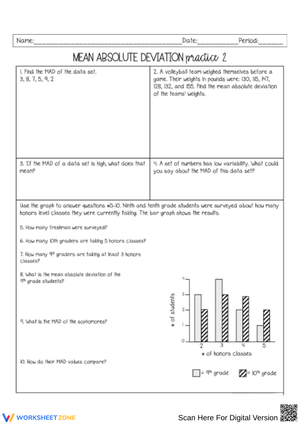
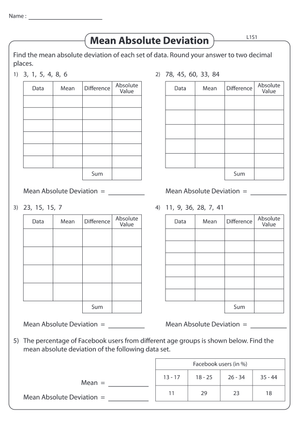
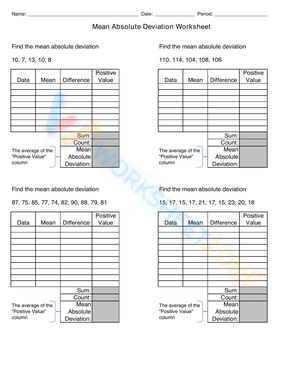
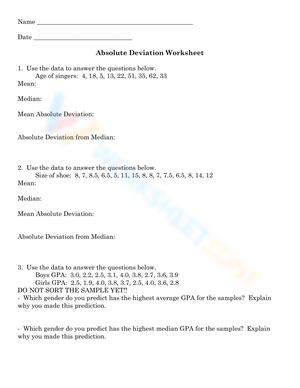
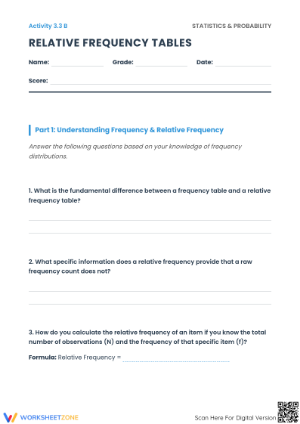
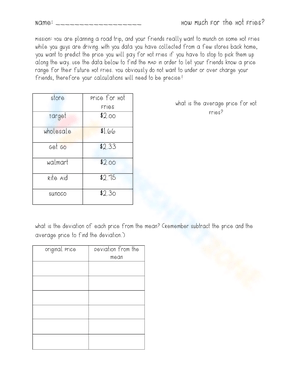
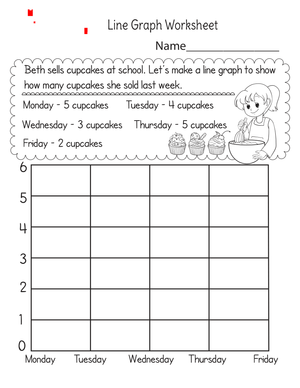
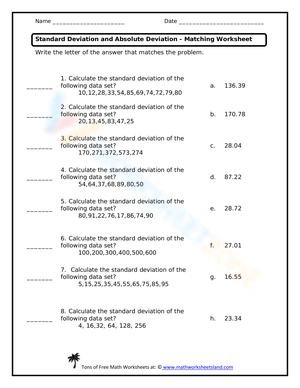
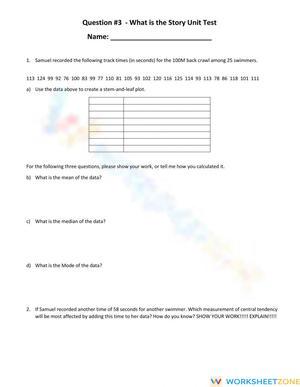
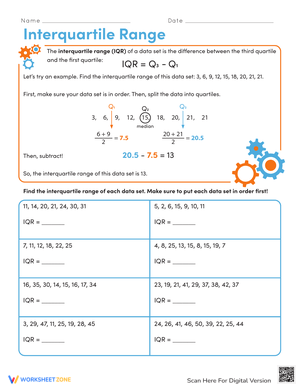
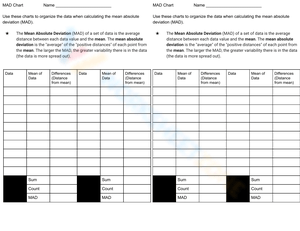
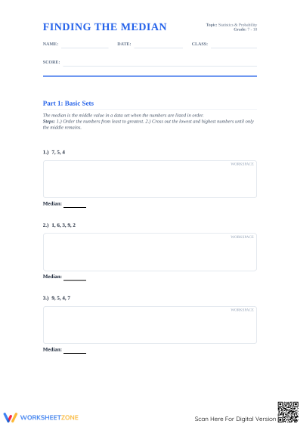
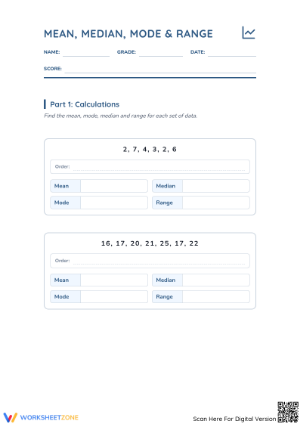
These 8th grade statistics worksheets resources give middle school math teachers printable practice covering the full arc of Grade 8 data analysis — from computing measures of center and spread to comparing distributions and writing evidence-based explanations of what the data actually show. Each worksheet targets a specific skill or a deliberate combination of connected skills, so teachers can pull the right resource for direct instruction, independent practice, intervention, or review without repurposing material that doesn't fit the moment.
The Specific Skills Each Worksheet Targets
The set addresses statistics skills students encounter across the middle grades and apply with greater independence by Grade 8. That range matters because many students arrive in 8th grade having calculated a mean before but having never explained why the median might be a more honest description of a skewed data set. These worksheets push past computation into that reasoning layer.
- Measures of center: mean, median, and mode, with follow-up prompts asking which measure best fits the data set and why
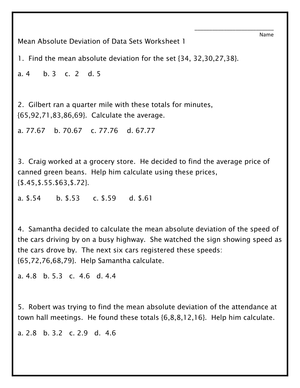
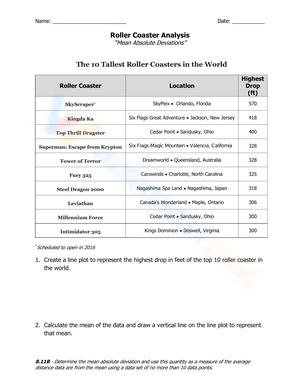
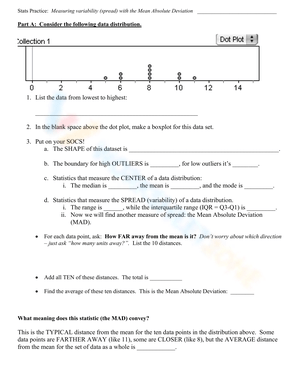
- Measures of spread: range and interquartile range, calculated from raw data sets and read directly from box plots
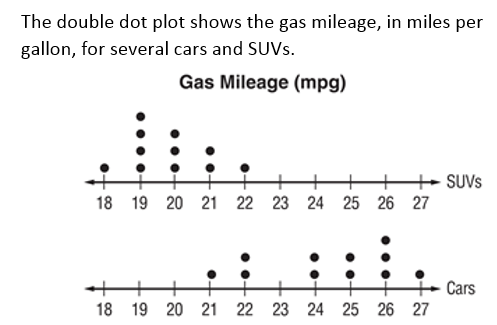
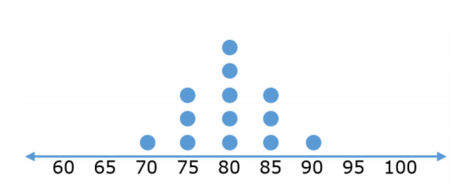
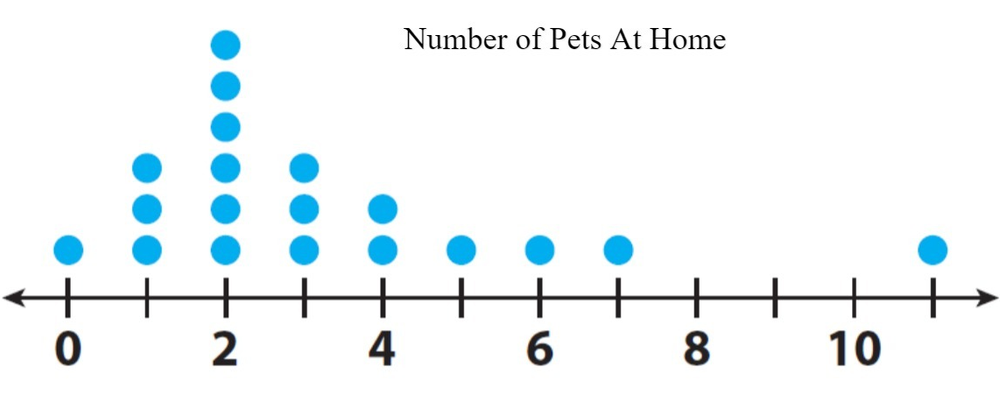
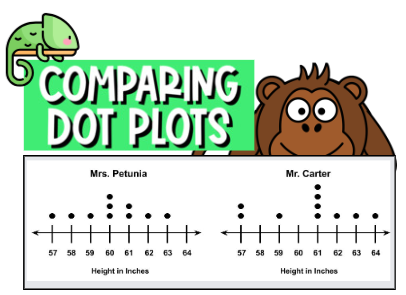
- Data displays: dot plots, histograms, and box plots — both constructing them from raw numbers and interpreting displays that are already built
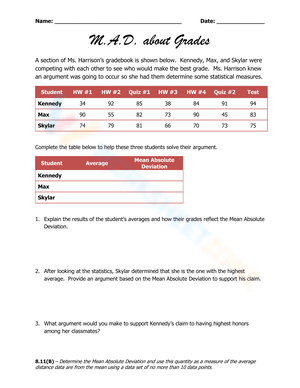
- Comparing two distributions: identifying which group has a greater center, which has more variability, and justifying both claims with specific values
- Describing patterns: noting clusters, gaps, outliers, and the overall shape of a distribution in plain language
- Sampling scenarios: evaluating whether a conclusion drawn from sample data is reasonable given the sampling method described
Worksheets that ask for written justification alongside calculation reveal more about student understanding than computation-only practice. When a student writes "the median is 14, which means half the values in the data set fall below 14," that's different from a student who found 14 by following a memorized procedure without knowing what it represents.
Patterns in Student Work Worth Watching For
A few misconceptions appear in nearly every class and are worth anticipating before students encounter them independently. The most persistent involves even-numbered data sets: students who correctly identify that the median falls between the two middle values will still write one of those values — say, 9 — instead of averaging 9 and 12 to get 10.5. That error almost never surfaces during practice with odd-numbered data sets, so any worksheet that includes at least one even-set problem makes this gap visible before it becomes a test-day problem.
The comparison task presents a different challenge. When students look at two box plots where Distribution A has a higher median but a much wider spread, most will choose A as the "stronger" group without considering that Distribution B's tighter clustering might be more meaningful in context. The question "which group is more consistent?" is harder than "which group has the higher median?" — and worksheets that include both force students to hold two measures in mind simultaneously, which is the actual Grade 8 skill.
Histogram misreading is the third predictable stumbling block. Students trained on bar charts treat each bar as a single data value. A bar rising to a frequency of 6 above the interval 20–25 gets read as "the data value is 20" rather than "six values fall somewhere between 20 and 25." A labeled diagram with one or two interpretation questions on any histogram worksheet catches this early.
Fitting These Worksheets Into Your Lesson Plans Without Rebuilding the Unit
The most practical approach is sorting worksheets by instructional purpose rather than by topic alone. A frame that works well in practice: introduce, practice, reteach, spot-check. An introduction worksheet is short and guided, built around one idea. A practice worksheet builds independence — more items, mixed representations. A reteach worksheet isolates a single misconception rather than surveying the whole topic. A spot-check worksheet combines three or four connected skills and quickly shows which students need another pass before the unit assessment.
Within a week, a box plot sequence might run like this: a short measure-of-spread worksheet as a warm-up Monday while students settle in, a guided box plot construction worksheet during direct instruction Tuesday, a comparison worksheet for partner work Wednesday, then a reteach worksheet Thursday for the students who consistently ignored spread in Wednesday's comparison. That kind of targeted use gets more from a printable set than treating every worksheet as interchangeable review.
Pairing any interpretation worksheet with a sentence frame raises the quality of student responses noticeably. Frames like The median of ___ tells me that half the values fall below ___ or Set B is more variable because its IQR of ___ is greater than Set A's IQR of ___ don't lower the thinking demand — they make the reasoning visible on paper so teachers can read what students actually understand rather than inferring it from a circled number.
Standard Alignment
The skills addressed in this set connect to standards across the Grade 6–8 statistics progression. Measures of center and spread trace back to 6.SP.B.5 (summarizing numerical data sets in relation to their context) and 7.SP.B.3–4 (drawing informal comparative inferences about two populations). These are standards students are expected to carry into 8th grade — which is why 8th grade teachers often use focused statistics worksheets for review and targeted intervention rather than re-teaching these concepts from the beginning.
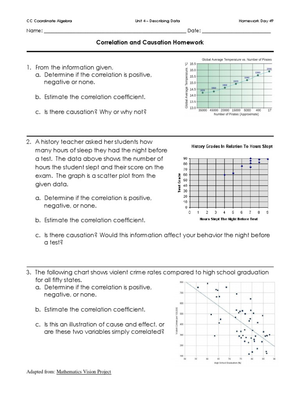
The core 8th grade statistics domain in the Common Core State Standards (8.SP.A.1–4) focuses on scatter plots, association, and two-way tables for categorical data. Teachers using 8th grade statistics worksheets materials to prepare students for state assessments should know that scatter plot and bivariate data skills require additional resources beyond the center, spread, and distribution comparison practice in this set. This set is strongest for reinforcing the foundational statistics skills students bring to 8th grade and for closing gaps before those skills need to transfer into the 8.SP context.
Adjusting the Worksheets for Different Readiness Levels in the Same Class
Grade 8 classes rarely land in one place on statistics readiness. Some students can compare two box plots and articulate a difference in variability using specific values; others still confuse the mean and the median. Worksheets make level adjustments manageable because you can change the numbers and the prompt structure without building an entirely different task.
For students who need more support, data sets of five to seven whole numbers with labeled calculation steps — find the sum: ___, divide by the count: ___, mean: ___ — keep the cognitive demand on the concept rather than on organizing the work from scratch. For on-level practice, data sets of ten to twelve values with a mix of graph reading and short written comparisons work well. The most rigorous 8th grade statistics worksheets tasks ask students to analyze what happens to the mean when an outlier is removed, or to argue which measure of center best describes a clearly skewed data set and explain why. That last task — choosing and defending a measure — appears consistently on state assessment items and is worth building into extension practice early.
Frequently Asked Questions
Are these worksheets appropriate for intervention groups, or are they built for whole-class instruction?
Both, depending on which worksheets you select. Short, focused worksheets with one main skill work well for small-group intervention because teachers can work through them alongside students and address misconceptions in the moment. Mixed-review worksheets with multiple representations are better suited to whole-class independent practice or homework. The fit depends on matching the worksheet format to the instructional purpose, not assuming every worksheet serves the same role.
How many worksheets do teachers typically use to cover a full statistics unit in Grade 8?
A typical 8th grade statistics unit spans two to three weeks. Most teachers use eight to twelve worksheets across that span — a few focused worksheets per concept, plus a mixed review toward the end. Having several reteach worksheets available matters more than total count, since small-group reteach is where targeted printable resources save the most planning time.
Do the worksheets include answer keys?
Answer keys are especially valuable for statistics practice because many questions involve short written responses, and a model answer helps teachers evaluate whether a student's explanation is complete. When selecting any set of 8th grade statistics worksheets materials, prioritize sources that include answer keys with sample justifications — not just numerical answers — particularly for comparison and interpretation questions where student wording reveals whether the concept landed.
What is the difference between a dot plot worksheet and a histogram worksheet at this grade level?
Dot plots show individual data values and work well with small data sets where students can see every point. Histograms group values into intervals and suit larger data sets where the overall shape of the distribution matters more than any individual value. At Grade 8, students should read both fluently — and should understand that a histogram doesn't reveal exact values, only how many fall within a range. A worksheet that asks students to name something a histogram cannot tell them is more rigorous than one that only asks them to read the bar heights.













 Interactive Worksheet Maker
 Quiz Maker
 Word Search Maker
 Crossword Puzzle Maker
 Word Scramble Generator
 Sentence Scramble Generator
 Handwriting Worksheet Generator
 Name Tracing Generator
 Fill In The Blank Generator