


























Views
Downloads



Essential Grade 8 Data Analysis & Statistics Worksheet
Paste this activity's link or code into your existing LMS (Google Classroom, Canvas, Teams, Schoology, Moodle, etc.).
Students can open and work on the activity right away, with no student login required.
You'll still be able to track student progress and results from your teacher account.
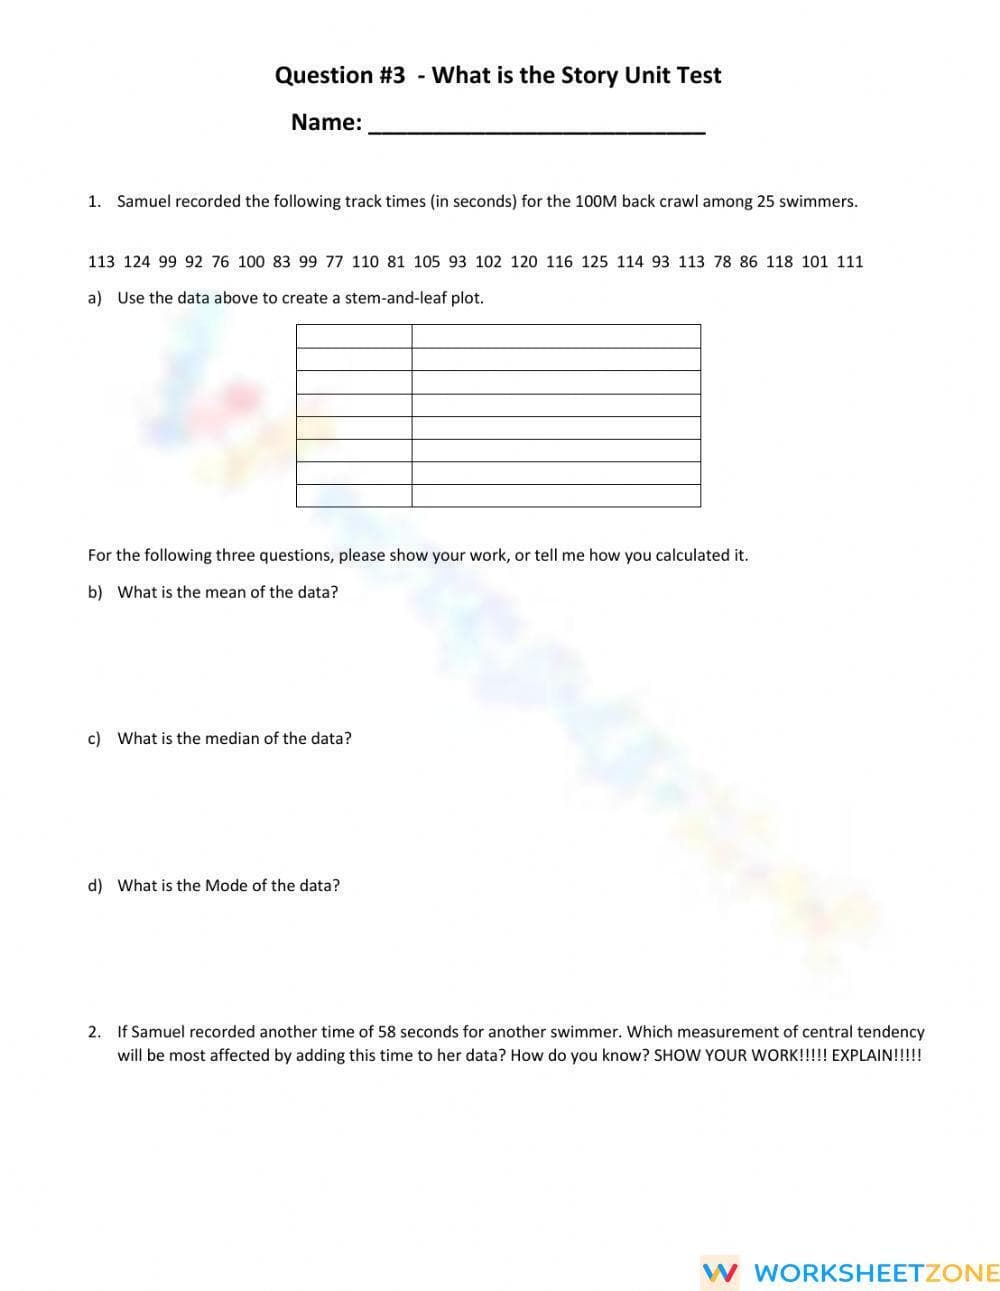
This Grade 8 data analysis worksheet provides a comprehensive assessment of statistical literacy. Students demonstrate proficiency by organizing raw data into visual representations and calculating measures of central tendency. By evaluating how outliers affect the mean and median, learners develop a deeper understanding of data distribution and reliability in real-world contexts.
At a Glance
- Grade: 8 · Subject: Data
- Standard:
CCSS.MATH.CONTENT.6.SP.B.5— Summarize numerical data sets in relation to their context- Skill Focus: Central Tendency & Data Representation
- Format: 4 pages · 6 problems · Answer key included · PDF
- Best For: Summative unit assessment or test prep
- Time: 45–60 minutes
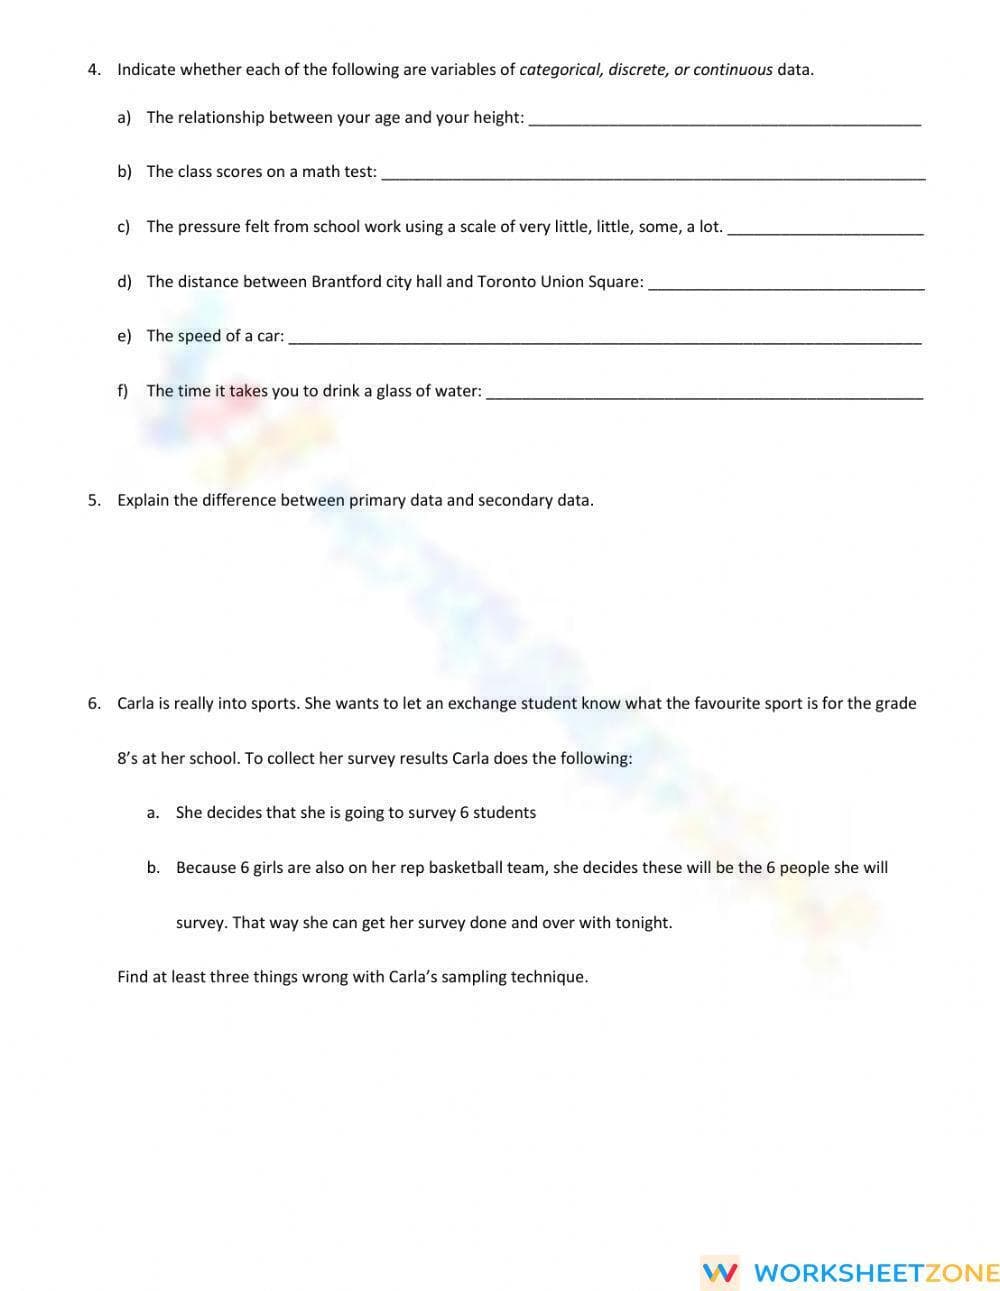
The resource contains 4 pages of rigorous mathematical tasks. It includes a raw dataset of 25 values for stem-and-leaf plot construction, dedicated space for histogram generation, and short-answer prompts for mean, median, and mode calculations. Structural features include a classification table for variable types and a scenario-based critique of sampling techniques to ensure conceptual depth.
This assessment provides clear evidence of student mastery across three distinct tiers. The Approaching level focuses on the mechanical calculation of averages. The Meeting level requires students to accurately translate data into histograms and plots. The Exceeding level challenges students to explain the mathematical impact of outliers and identify bias in primary data collection. Scores can be entered directly into gradebooks or used for IEP progress monitoring.
The primary focus is CCSS.MATH.CONTENT.6.SP.B.5, which requires students to summarize numerical data sets in relation to their context. This resource also aligns with the Ontario 2020 Curriculum for Grade 8 Data Management. Both standard codes can be copied directly into lesson plans, IEP goals, or district curriculum mapping tools.
Use this worksheet as a summative unit test after completing instruction on statistics. It also functions effectively as a high-stakes review before state testing. During the session, observe if students correctly order data before finding the median. Expect completion within 45 to 60 minutes depending on the level of detail provided in the sampling critique.
This resource is designed for Grade 8 and 9 students mastering the statistics strand of the curriculum. It is particularly useful for learners who need to bridge the gap between simple calculations and critical data analysis. Pair this with a scatter plot activity or a lesson on biased versus unbiased sampling for a complete instructional cycle.
According to Fisher & Frey (2014), the ability to translate raw numerical data into visual formats like histograms is a critical indicator of mathematical fluency and conceptual understanding. This worksheet addresses the CCSS.MATH.CONTENT.6.SP.B.5 standard by requiring students to not only calculate measures of central tendency but also to interpret the story behind the numbers. By analyzing how a single outlier of 58 seconds shifts the mean, students engage in higher-order thinking that transcends rote memorization. Research indicates that students who can identify sampling bias and distinguish between primary and secondary data are better prepared for the rigors of high school statistics and probability. This 4-page assessment provides the structured environment necessary for students to prove their competence in data management and statistical reasoning.


