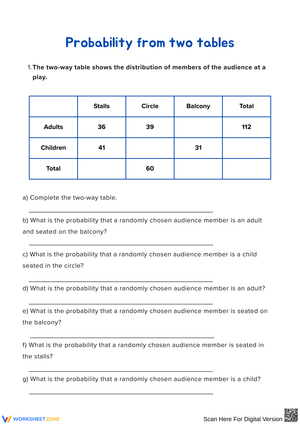
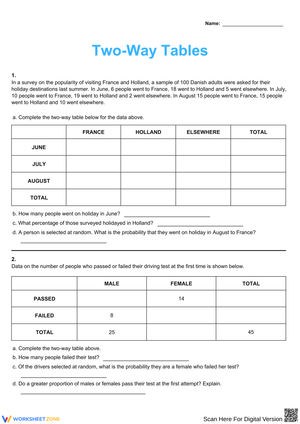
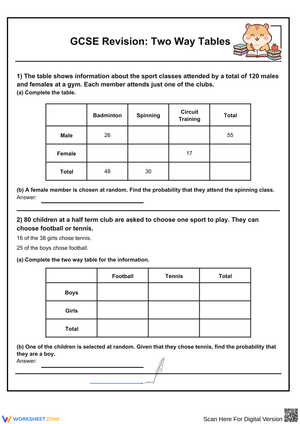
Two Way Tables Printable Worksheets for 8th Grade
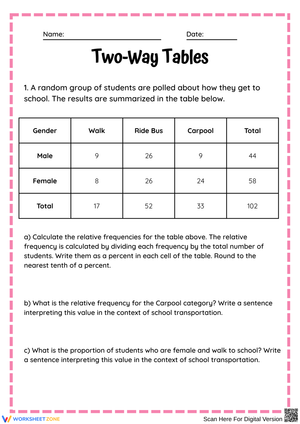
Two way tables printable worksheets for 8th grade give teachers a direct path into one of the trickier statistics standards at this level — organizing bivariate categorical data, computing frequencies in three different ways, and then writing something meaningful about what the numbers actually show. The set covers joint frequencies, marginal frequencies, conditional relative frequencies, and identifying associations, which is the full scope of what students need before high school statistics. Teachers who have worked this unit before know it looks simpler than it is until students hit the denominator problem with conditional frequencies.
The Skills These Worksheets Target
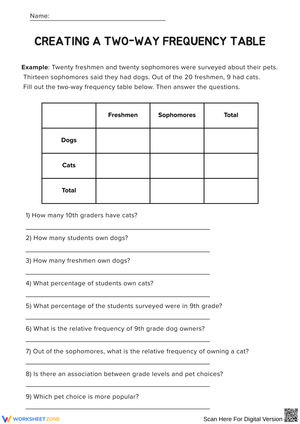
Each worksheet focuses on a specific layer of the two-way table process rather than asking students to do everything at once. Early worksheets build the table itself from word-problem survey descriptions — students read a paragraph, identify the two categorical variables, and place raw counts into the correct cells. That step alone separates students who understand the structure from those who are just copying numbers without understanding what a joint frequency represents.
Later worksheets push into relative frequencies, which is where the real cognitive work happens. Students compute row-relative frequencies, column-relative frequencies, and whole-table relative frequencies on separate exercises so they can see why the denominator choice changes the interpretation entirely. The final worksheets in the set ask students to compare conditional relative frequencies across categories and write a sentence — not a numerical answer, a sentence — that either claims or denies an association between the two variables, with data as the support.
- Reading and constructing two-way tables from survey descriptions
- Calculating joint frequencies and verifying row and column sums
- Computing marginal frequencies from accumulated row and column totals
- Converting raw counts to relative frequencies using the grand total
- Calculating conditional relative frequencies by row or by column
- Writing data-supported conclusions about association or no association
Mistakes Students Make That These Worksheets Help You Catch
The denominator error with conditional relative frequencies is the most persistent problem in this unit. A student will correctly identify that 24 out of 60 eighth graders prefer soccer, then divide by 120 — the grand total — rather than by 60. The answer looks plausible (0.2 instead of 0.4), which means students don't flag it as wrong on their own. What tends to work is making the denominator choice explicit before any calculation begins: students circle the row total or column total they plan to divide by, write it as the denominator of a fraction with a blank numerator, and then fill in the joint frequency. The circling step forces a deliberate decision rather than a reflexive grab at whichever number is largest.
A second pattern shows up when students write association conclusions. Most will write something like "40% of students who play an instrument also take art class." That's a calculation, not a conclusion. They haven't compared it to anything. The conclusion only becomes an association claim when students note that this percentage differs meaningfully from the corresponding percentage in the other row — students who do not play an instrument. Teaching students to write "compared to only 18% of students who do not play an instrument" as part of the same sentence requires explicit modeling; it doesn't emerge naturally from computation practice alone.
Standard Alignment
These worksheets address CCSS.MATH.CONTENT.8.SP.A.4, which asks students to construct and interpret two-way tables summarizing data on two categorical variables collected from the same subjects, and to use relative frequencies calculated for rows or columns to describe possible associations. In the Common Core progression, this standard sits at the end of the 8th grade statistics domain and draws on students' earlier work with proportional reasoning and percent from grades 6 and 7. That instructional placement matters: students who struggled with ratio and percent in 7th grade often arrive at 8.SP.A.4 carrying a compounded difficulty — a new data structure on top of percent calculations that aren't yet automatic. The worksheets that treat relative frequency computation as its own isolated step, separate from table construction, keep those two challenges from colliding at the worst moment.
How to Work These Worksheets Into Your Lesson Plans
The table-construction worksheets work well as guided practice during initial instruction. Project the word problem, give students 90 seconds to read it independently, and then build the empty table shell together before students fill in joint frequencies on their own copies. Checking marginal sums at this point — before any relative frequency work begins — functions as an error gate. If a student's row sum doesn't match the marginal frequency given in the problem, something was misplaced, and correcting it now costs far less than discovering the error after a full relative frequency table has been computed on wrong numbers.
Two way tables printable worksheets for 8th grade that focus on conditional relative frequencies are better suited to small-group work than independent seat work, at least in the first lesson or two. The denominator decision is easier to talk through than to decode from a written explanation alone. Once students have genuinely disagreed about whether to divide by 60 or 120 and then resolved it together, they internalize the logic in a way that a worked example on the board doesn't reliably produce. The association-conclusion worksheets, on the other hand, make strong exit tickets — short enough to complete in six or seven minutes and clear enough to reveal who can produce a mathematically grounded claim versus who is still just restating a number.
Adjusting These Worksheets for Students at Different Levels
For students who need more support, pre-fill the table structure — row and column labels already in place, marginal totals provided — so students are extracting and placing joint frequencies rather than setting up the grid from scratch. Removing the setup step lowers the initial barrier without reducing the statistical thinking required. Some students benefit from having the grand total circled before they begin any division; others need the formula written explicitly beside each cell they're converting: joint frequency divided by row total equals conditional relative frequency. That level of written reminder is often enough to break the automatic reach toward the wrong denominator.
Students who move through the core material quickly can push into two extensions the standard worksheets don't require. First, ask them to reverse the process: given a completed relative frequency table, reconstruct the original raw-count table using only a specified grand total. Second, have them design a two-category survey question, collect 20 responses from classmates, and build their own table — then write the association conclusion. That task tests genuine understanding because no answer key exists; the data belongs to them. Students working through two way tables printable worksheets for 8th grade at an accelerated pace often find that generating their own data exposes gaps that structured exercises don't.
Frequently Asked Questions
What is the difference between a joint frequency and a marginal frequency?
A joint frequency occupies one interior cell of the table — it counts subjects who fall into a specific combination of both categories at once, such as students who prefer science and play a sport. A marginal frequency is a row or column total, found at the outer edge of the table. It counts subjects along one category at a time, ignoring the other variable entirely. Students who confuse these often try to use a marginal frequency as the numerator in a conditional calculation, which produces a result greater than 1 and flags the error immediately if students know to expect a value between 0 and 1.
Do the worksheets cover both row-relative and column-relative frequencies, or only one direction?
The set covers both, with separate worksheets for each approach before combining them. Row-relative frequencies divide each joint frequency by its row total, which answers questions like "Of all students who play a sport, what fraction prefer science?" Column-relative frequencies divide by the column total and answer questions from the other direction. Students need to see both because the direction of the conditional depends entirely on the question being asked — conflating the two is one of the more stubborn errors in the unit.
How many worksheets focus on writing the association conclusion, rather than just computing frequencies?
Three worksheets address the conclusion step directly, which is more dedicated practice than most published materials provide for this piece of the standard. The reasoning is straightforward: students can compute a conditional relative frequency correctly and still write a conclusion that amounts to restating one number. The conclusion worksheets require a comparison — two percentages from different rows or columns placed against each other — and do not accept a single-number summary as a finished response. Students who find this the hardest step usually do so because they've never been asked to write a statistical claim before; these worksheets make that expectation explicit rather than leaving it implicit until the test.
Are the data contexts relevant to 8th graders, or are they generic filler scenarios?
The surveys and scenarios use contexts drawn from 8th-grade life: preferred lunch options by grade level, participation in after-school activities, screen time habits, and sports preferences. These weren't chosen for vague "engagement" reasons — they were chosen because students already carry intuitions about the data, which means they can sense-check their answers. If a conditional relative frequency calculation suggests that 94% of students who play video games also prefer math class, a student familiar with the context will question that result immediately. Generic industrial or economic data doesn't produce that self-correction reflex.
Clear All