8th Grade Two Way Frequency Tables Worksheets Printable
These 8th grade two way frequency tables worksheets give students structured practice reading, completing, and interpreting tables that organize two categorical variables at once — moving from straightforward totals to relative frequency and probability extensions within the same skill set. Each worksheet builds on a consistent table format, which means students spend their cognitive effort on the reasoning, not on decoding a new layout every time.
What's Inside the Set
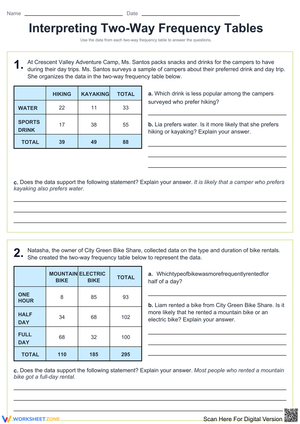
Every worksheet centers on a two-way table drawn from a recognizable school context — survey results on sports preferences by grade, transportation choices cross-referenced with after-school activities, or lunch selections sorted by homeroom. Familiar data keeps attention on the math rather than the situation.
Across the set, students practice the full range of skills the topic requires:
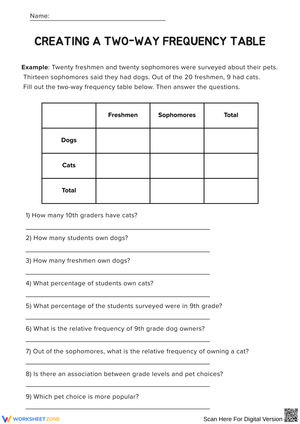
- Joint frequencies: reading and entering the counts that appear inside the table where two categories intersect
- Marginal totals: computing row totals and column totals by adding across or down the table
- Grand totals: finding the total number of data points and checking that row sums and column sums agree
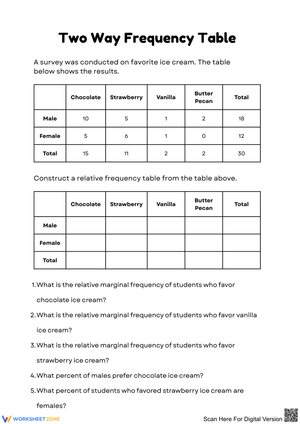
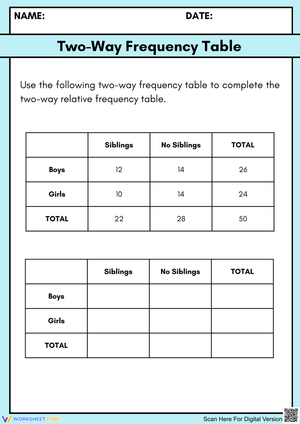
- Relative frequency: converting counts to fractions, decimals, or percents using a row total, column total, or grand total as the denominator — depending on what the question actually asks
- Interpretation prompts: writing short explanations of what the data shows, citing specific counts rather than describing patterns in vague terms
Early worksheets present a fully labeled table with some cells missing; students fill in frequencies and then answer guided questions. Later worksheets remove that scaffolding and ask students to construct a table from a paragraph-length survey summary before answering the same kinds of questions. That progression keeps the format from feeling repetitive while steadily raising the demand.
Standard Alignment
These worksheets address CCSS 8.SP.A.4, which calls for students to understand patterns of association in bivariate categorical data by constructing and interpreting two-way frequency tables, using relative frequencies to describe possible associations. In instructional terms, this standard sits at the end of the 8th grade statistics progression — students have already worked with scatter plots and linear associations in numerical data, and two-way tables extend that investigative habit to categorical data. The relative frequency work in particular prepares students for conditional probability reasoning they will encounter formally in high school statistics.
Frequent Student Errors Worth Watching For
The most consistent mistake across grade levels involves the denominator in relative frequency problems. Students default to dividing by the grand total even when the question specifies "of the students who chose soccer" — which signals a row or column total, not the whole table. The error makes sense developmentally: students have spent years dividing a part by a whole, and the grand total feels most like "the whole." What these worksheets make explicit is that which total you divide by depends entirely on the question's scope, and that scope is encoded in the row and column labels.
A second error is directional confusion. Students adding down a column to answer a question about a row category — or vice versa — appears in roughly half of papers before explicit instruction on checking labels. One classroom move that reduces this: before students answer any question, have them lightly shade the row or column the question refers to in pencil. The shading makes it visually obvious when the arithmetic is about to go in the wrong direction.
A third pattern is vaguer but harder to fix: students writing interpretation answers that describe the table layout rather than what the data says. "The table shows different sports and grades" is not an interpretation. The worksheets include sentence-starter prompts on several pages to push students toward evidence-based claims — "According to the table, ___ out of ___ students who preferred soccer also ___."
Smart Ways to Work These Worksheets Into Your Week
A three-phase lesson structure works well with this set. Open with a five-minute whole-class read-aloud of the table — narrate each label, each row, and where the totals go. Then model one complete problem at the board, thinking aloud about which total to use for a relative frequency question. The first worksheet then serves as guided practice, which most classes can work through in pairs in about fifteen minutes before a brief class share-out.
For station rotations, three stations map naturally onto the skill progression: one station completes missing frequencies in a table, a second interprets a completed table by answering comparison and relative frequency questions, and a third converts counts to percents and connects the results to a simple probability prompt. Students move through all three over two class periods, which allows grouping by readiness without restructuring the whole lesson.
The worksheets also work as Monday warm-ups during a statistics unit. A single table with three to four questions takes about eight minutes — enough to re-activate the prior week's vocabulary (joint frequency, marginal total, relative frequency) before moving into new instruction. That spaced retrieval across multiple sessions produces more durable understanding than massing all the practice into one block.
Adjusting the Worksheets for a Range of Learners
Students who are still shaky on fraction-to-percent conversion benefit from a printed reference strip clipped to the worksheet — the bottleneck for those students is the conversion arithmetic, not the table reasoning, and removing that obstacle keeps the focus where it belongs. For students who are ready for more, the interpretation prompts can be extended: instead of writing one sentence about what the data shows, they write a brief argument for whether the two variables appear associated, citing at least two relative frequencies as evidence. That extension does not require a different worksheet — it just changes the written response expectation.
For students who freeze when asked to build a table from a text description, the gradual release moves in a specific order: first, provide the completed table and ask questions; second, provide the table with marginal totals missing; third, provide the table with interior cells missing; only then ask students to construct the full table from a description. Skipping steps in that sequence is where students lose the thread.
Frequently Asked Questions
What does "relative frequency" mean in the context of these worksheets?
Relative frequency is a count expressed as a fraction or percent of some total. In a two-way table, that total might be a row total, a column total, or the grand total depending on the question. The worksheets make this distinction explicit because choosing the wrong denominator is the most common source of errors on assessments.
How are these worksheets different from general statistics practice?
Every worksheet in the set is built around the two-way table format specifically — students are not switching between histograms, dot plots, and tables from page to page. That consistency allows the reasoning skills (reading categories, distinguishing marginal from joint frequencies, interpreting association) to build cumulatively across the set rather than resetting with each new format.
At what point in a unit should these worksheets be introduced?
The first two worksheets work well as initial guided practice once students have seen a two-way table read aloud as a class. The middle worksheets fit independent practice after two or three lessons. The final worksheets — which connect relative frequency to probability reasoning — work best as review or enrichment near the end of a statistics unit, after students are comfortable with the table structure itself.
Clear All