Statistics worksheets printable for 6th grade work best when they push past computation into interpretation — and this set does exactly that, pairing calculation tasks with the harder question: what do these numbers actually say about the data? The resources cover mean, median, mode, and range alongside reading distributions in dot plots, histograms, and box plots — the full scope of what Grade 6 statistics standards expect students to do, not just calculate.
The Specific Skills Each Worksheet Targets
Grade 6 is when the curriculum formally separates statistical thinking from arithmetic. Students are no longer just computing with numbers — they are analyzing data sets, identifying patterns, and making defensible claims. Each worksheet in the set addresses one or more of the following:
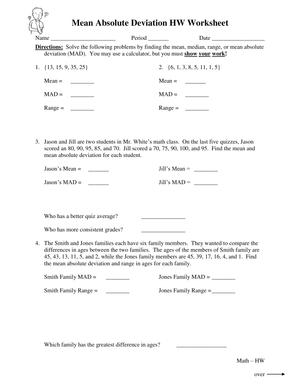
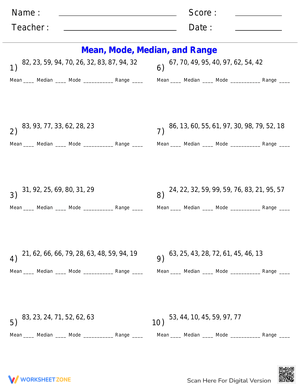
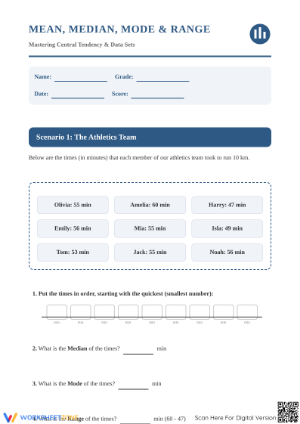
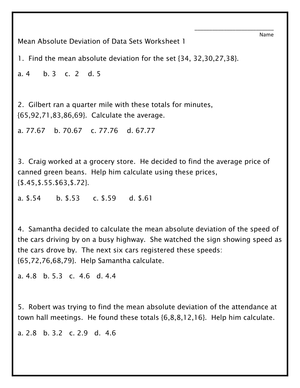
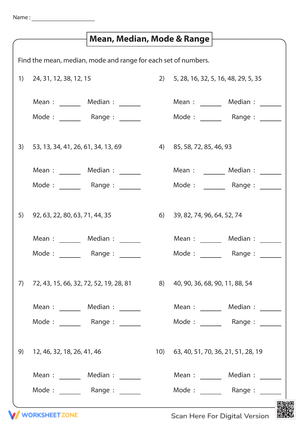
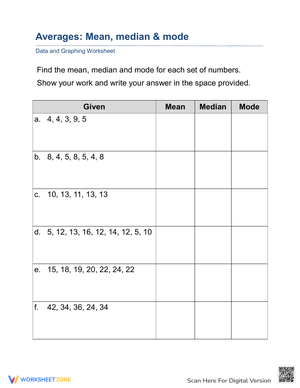
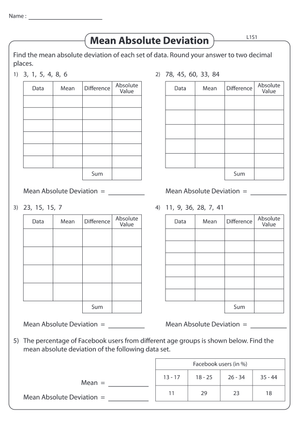
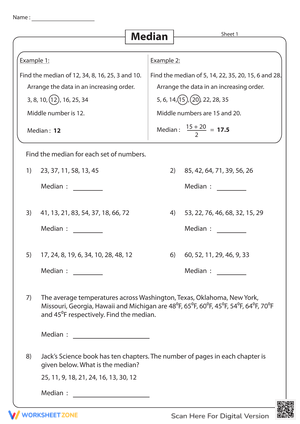
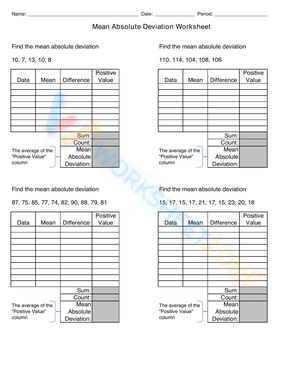
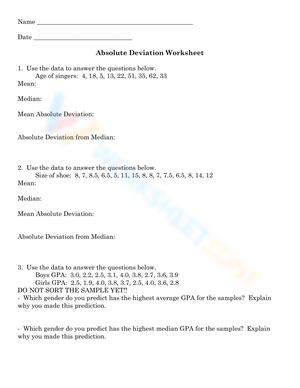
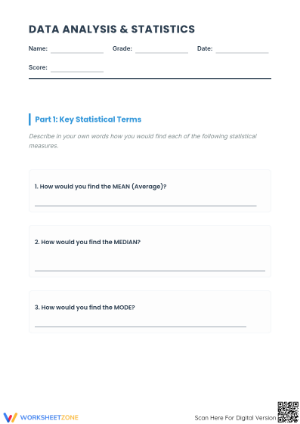
- Calculating mean, median, mode, and range from raw numerical data
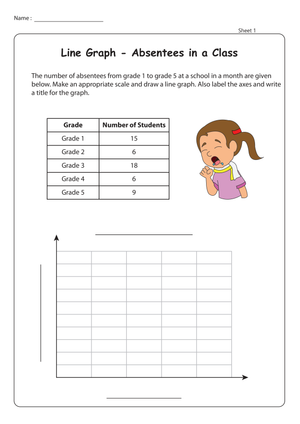
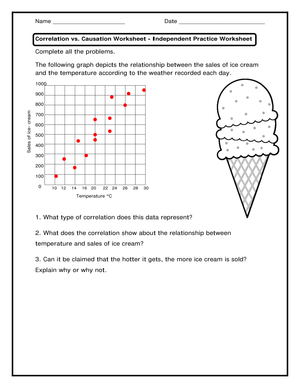
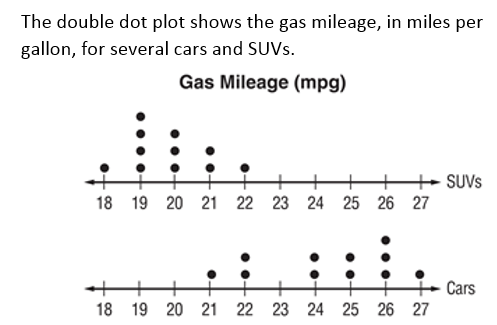
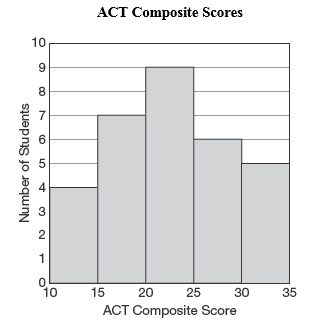
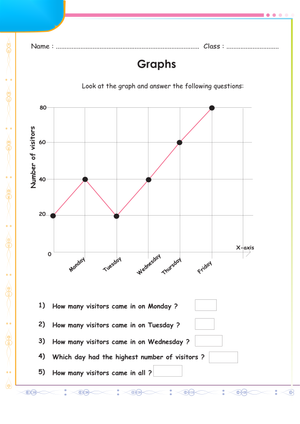
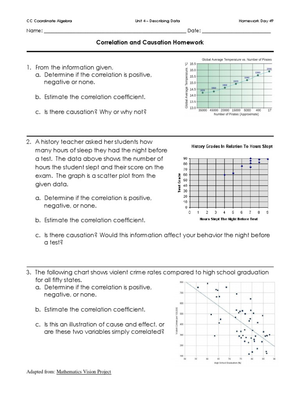
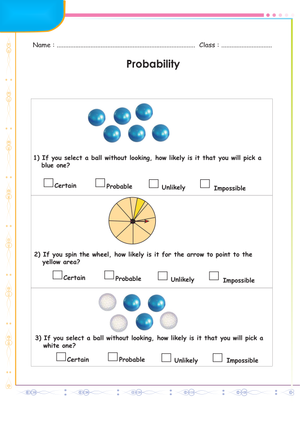
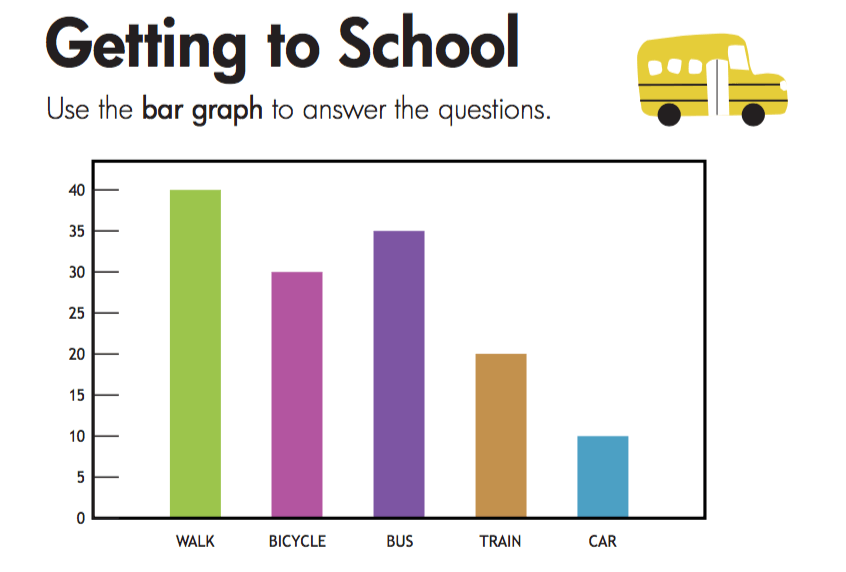
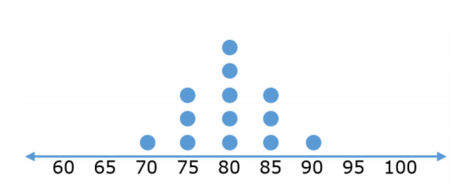
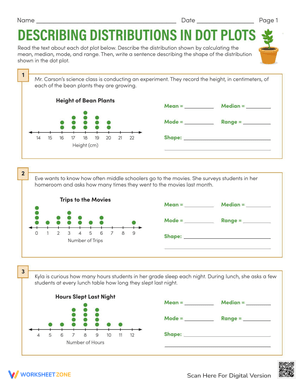
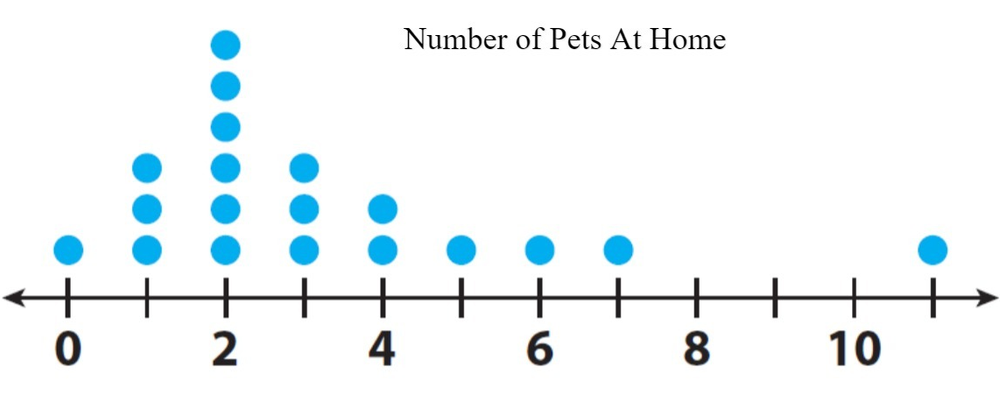
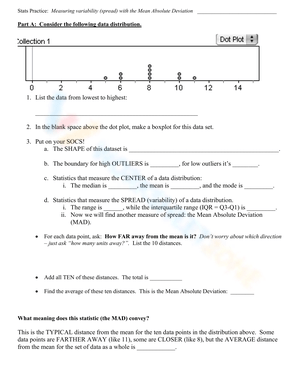
- Reading and interpreting dot plots, histograms, frequency tables, and box plots
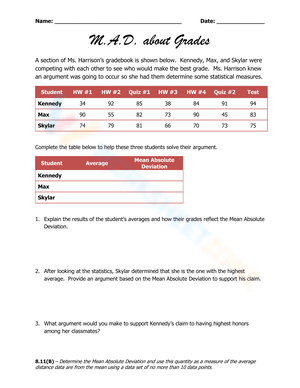
- Comparing two data sets by examining center and spread
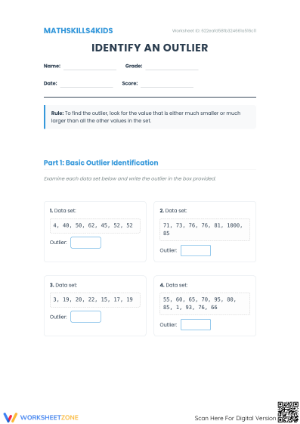
- Describing distribution features: clusters, gaps, peaks, and outliers
- Deciding which measure of center best represents a specific data set and explaining why
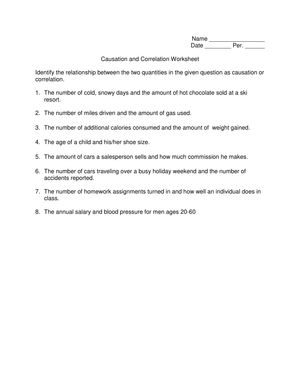
- Writing short, evidence-based conclusions tied to real-world contexts
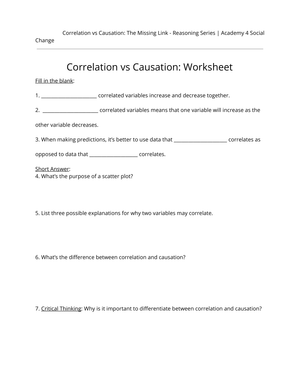
The written-explanation tasks deserve attention on their own. Middle school students frequently treat statistics as a sequence of calculation steps — find the median, done. The open-response prompts across these worksheets require students to state what the median tells them about the actual situation, which surfaces gaps that a computation-only check never will.
Student Errors Worth Anticipating Before You Assign
A few error patterns appear reliably in 6th grade data work. The most persistent: students who confidently find the median of a five-value list will leave a six-value list with the wrong answer — they pick one of the two middle values rather than averaging them, and they look certain when they do it. A second error involves units and context. Students write "the mean is 14.3" and stop. They have answered the computation, but when asked what 14.3 means in the problem's context, they go blank. A third error shows up specifically on histograms: students count the number of bars instead of reading the frequency axis, producing answers that are off by large margins and appear confident on paper. These worksheets include questions structured to surface all three patterns before a unit assessment does.
How to Work These Worksheets Into Your Week
Statistics worksheets printable for 6th grade slot naturally into the routines that already structure a math period. A focused bell-work task — four minutes on finding mean and median from a small data set — is enough to keep the skill active without consuming instructional time. A dot-plot interpretation worksheet works well on a day when students are transitioning between representations and need a low-stakes check before the lesson moves forward. For Friday review blocks, a mixed-measure worksheet that asks students to calculate, compare, and explain gives a clearer picture of where the class actually stands than a quick exit ticket.
Small-group reteaching is where these resources earn their keep. When a handful of students are confusing mode and median, pulling one targeted worksheet on measures of center — with direct prompts to label each measure clearly — takes about eight minutes and resolves the confusion without reteaching the whole class. Having worksheets sorted by graph type and skill rather than by lesson order makes those last-minute pulls much faster to execute.
Standard Alignment
This set aligns to the Common Core State Standards for Grade 6 Statistics and Probability, specifically 6.SP.A.2, 6.SP.A.3, 6.SP.B.4, and 6.SP.B.5. Standard 6.SP.B.4 requires students to display numerical data in dot plots, histograms, and box plots — the graph-reading and interpretation tasks across these worksheets address that standard directly. Standard 6.SP.B.5 carries the most weight on end-of-unit assessments at this grade: students must summarize numerical data sets in relation to context, report measures of center and variability, and describe the overall distribution pattern. The written-reasoning questions in this set mirror the language and format teachers see on formal 6.SP.B.5 items, making the worksheets useful for both instruction and targeted review.
Making the Set Work Across Ability Levels
Statistics is a topic where the same core task can be adjusted in depth without designing a completely different lesson. For students who need more support, use worksheets with smaller whole-number data sets, single-graph formats, and step-by-step prompts — "list the values in order," "circle the middle value" — before asking for a final answer. On-level work should combine computation with interpretation: calculate the mean and explain what it tells you about the context. For students ready for more challenge, add items that ask them to compare two distributions, trace how a single outlier shifts the mean versus the median, or defend which measure of center is more appropriate when the data is skewed.
Statistics worksheets printable for 6th grade that include all three tiers within the same set let a teacher assign different worksheets to different groups without drawing attention to the distinction. Every student is working on statistics; the depth of reasoning required is what shifts.
Frequently Asked Questions
What data representations do the worksheets include?
The set includes worksheets built around dot plots, histograms, frequency tables, and box plots. Students read pre-made graphs and answer interpretation questions, and on several worksheets they construct their own representations from raw data sets.
Are these worksheets appropriate for use as sub plans?
Yes. Because the directions on each worksheet are self-contained and the task format is familiar to most 6th graders by mid-year, these work well when a substitute is covering the class. Selecting worksheets that review skills already taught — rather than introducing a new representation — keeps the period productive without requiring the classroom teacher to be present.
How do these worksheets fit into test prep?
Statistics worksheets printable for 6th grade that address 6.SP.B.4 and 6.SP.B.5 support end-of-year assessment preparation directly. The histogram and box-plot reading tasks reflect the format students encounter on state assessments, where graph interpretation appears alongside computation. A mixed-review worksheet covering center, spread, and distribution shape — used in the two weeks before a test — reinforces the full range of skills without requiring a separate review unit.
Do the worksheets include answer keys?
Answer keys are included with the full set, covering both computational answers and sample responses for the open-ended interpretation questions. The sample written responses are especially useful for teachers calibrating what a complete, well-reasoned answer looks like versus a partial one — a distinction that matters most when students are writing about data for the first time.