6th Grade Measures of Variation Printable PDF Worksheets
These 6th grade measures of variation printable pdf worksheets give teachers ready-to-use practice for one of the more conceptually demanding parts of the Grade 6 statistics unit — moving students from computing a single number to explaining what the spread of a data set actually means. Each worksheet targets a distinct skill: finding range, analyzing interquartile range, reading box plots, or comparing two data sets side by side. The resources work for guided practice, partner stations, homework, and end-of-unit review.
The Specific Skills Each Worksheet Targets
The central idea behind measures of variation — how spread out are the values? — seems simple enough, but sixth graders need structured repetition before that idea becomes fluent reasoning. Each worksheet in the set addresses one layer of that question, building toward the kind of interpretation the Grade 6 standards expect.
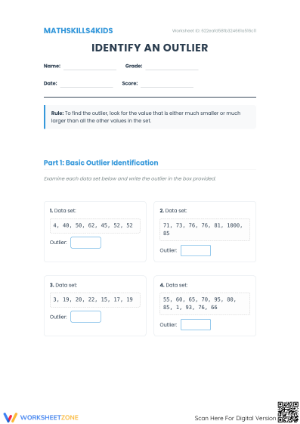
- Range: students identify the maximum and minimum values, find the difference, and describe what that number tells them about the data.
- Ordering and locating quartiles: students sort a data set, find the median, and identify the lower and upper quartiles before any variation measure is calculated.
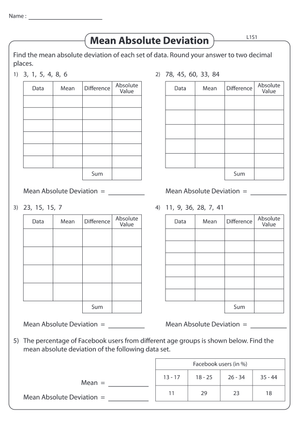
- Interquartile range: students subtract Q1 from Q3 and write a sentence explaining what the result says about the middle fifty percent of the values.
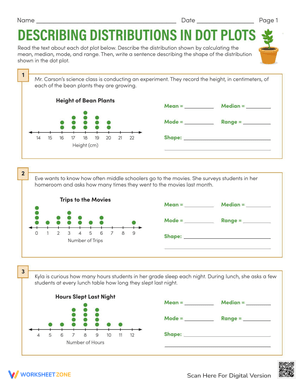
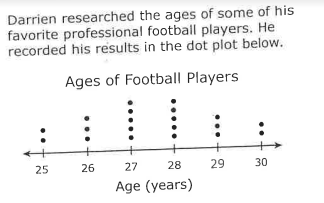
- Box plot reading: students interpret pre-made box plots, distinguishing the width of the box from the full span of the display.
- Data set comparison: students examine two data sets — sometimes as ordered lists, sometimes as parallel box plots — and determine which is more variable and why.
Keeping each measure on its own worksheet also helps students build distinct mental categories. A pattern that shows up repeatedly in student work: when variation measures are introduced in rapid sequence on the same day, students conflate them. Giving each measure its own practice session — with explicit labeling of what part of the data it describes — reduces that confusion more reliably than re-explanation after the fact.
Mistakes Students Make Before the Calculation Even Starts
The most common errors in this unit are not arithmetic mistakes. They are structural ones. Students who find range correctly from an ordered list will misidentify the maximum value when data is presented in random order and they skip the sorting step. On box plot tasks, students consistently measure interquartile range as the full width of the display — from the leftmost whisker to the rightmost — instead of reading the box alone. That misread produces a wrong answer even when the student understands what IQR means conceptually.
A subtler problem surfaces on comparison problems. Many sixth graders assume the data set with the higher median is automatically more spread out, treating center and variation as the same idea. The Grade 6 standards draw a deliberate line between those two concepts, and worksheets that present side-by-side data sets with equal medians but different interquartile ranges — one with an IQR of 3, another with an IQR of 11 — force students to engage with that distinction directly. Short written-response prompts following those problems reveal whether a student is reasoning or simply picking a number.
One practical move worth building into instruction early: before any calculation, ask students to mark what each measure actually describes. For range, they circle the smallest and largest values. For interquartile range, they draw a box around the middle half of the ordered data. This annotation habit reduces errors visibly and teaches students that different measures describe different parts of the same data set — a conceptual point that computation alone does not deliver.
Building These Worksheets Into a Statistics Unit
The most natural sequence across a five-day unit looks roughly like this: early worksheets on range serve as guided practice on days one and two, with students ordering data together before finishing the computation independently. Days three and four shift to interquartile range and box plots, which benefit from partner work because students can talk through what the box represents before writing anything down. The fifth day pulls it together with a mixed-review worksheet used as a formative check rather than a summative grade.
Outside a dedicated unit, individual worksheets slot naturally into the eight to ten minutes before instruction begins, when students need a low-stakes task they can start without explanation. Range problems work well there because the procedure is brief enough to finish before the lesson opens. Comparison and box plot worksheets belong later in the period, where there is time for brief class discussion after students complete them. Treating every worksheet as silent independent work misses the interpretive dimension of this content entirely.
Standard Alignment
These 6th grade measures of variation printable pdf worksheets align directly to CCSS.MATH.CONTENT.6.SP.B.5c, which requires students to summarize numerical data sets in terms of both center and variability. The worksheets address the variability side of that standard specifically — the portion that tends to receive less classroom time because it arrives late in the unit when the calendar is tight. Several worksheets also connect to 6.SP.B.4, which asks students to display and interpret data in dot plots and box plots. When students compute IQR directly from a box plot rather than from a data table, both standards are active in the same task.
Adjusting the Set Across a Range of Student Readiness Levels
Sixth grade classrooms carry wide variation in statistical background. Some students have worked with dot plots since fourth grade; others arrive with no experience ordering data sets. The same worksheets support both ends of that range with small adjustments that do not lower the mathematical demand.
- For students who need more entry-level support: use worksheets with pre-ordered data sets and add sentence frames — The range tells me the values differ by as much as ___ — so the writing step does not block the statistical reasoning.
- For on-level practice: worksheets with unordered data and mixed problem types push students to move between procedures and explanation within the same task.
- For students ready for more challenge: ask them to construct a data set from a constraint — a range of 18 with an IQR less than 7 — or to identify the flaw in a fictional student's interpretation of a box plot and explain the correct reasoning in their own words.
That last task — building a data set backward from a required measure — is more cognitively demanding than any calculation problem in the set. It works as extension work because it reveals whether students understand what range and IQR actually describe, or whether they only know how to compute them when numbers are already arranged on a page.
Frequently Asked Questions
Should range and interquartile range be taught together or in sequence?
In sequence. Range is the cleaner entry point — two values, one subtraction — and it gives students a working definition of spread before quartiles add complexity. Once students can explain why a range of 20 signals something different than a range of 3, they are ready to ask what happens when extreme values distort that picture. That question leads directly to IQR, and the transition lands better when students arrive at it through reasoning rather than through a new definition introduced from scratch.
My students can compute IQR correctly but cannot explain what it means. What addresses that gap?
Written responses, consistently required. Adding one sentence prompt to a computation problem — What does this number tell you about the data? — immediately surfaces the gap between procedural and conceptual understanding. 6th grade measures of variation printable pdf worksheets that include interpretation prompts after calculation items give teachers written evidence to respond to, rather than just a circled answer to mark correct or incorrect.
How do box plots connect to the computation worksheets?
Box plots make IQR visible in a way that lists of numbers do not. A student who can calculate IQR from a table still needs separate practice reading it from a plot, because the two tasks draw on different skills. Worksheets that pair a data table with its corresponding box plot — asking students to verify IQR both ways and explain what the box width represents — help students build one unified concept across formats rather than treating each as a separate procedure.
Are these worksheets appropriate for test preparation?
Measures of variation appear consistently on Grade 6 state math assessments, and the problem formats here — interpreting spread, comparing data sets, reading box plots — reflect what those assessments ask. That said, the stronger use for 6th grade measures of variation printable pdf worksheets is inside the unit itself, not in a final review week. Students who work through interpretation during instruction perform better on assessments than students who first encounter this material as test prep. Instruction-time practice carries more weight than any last-minute drill.
Clear All