These 6th grade mean median and mode worksheets cover calculation, data ordering, and interpretation through a range of problem types — from straight computation with small whole-number sets to word problems where students must decide which measure of center best fits the situation. Each worksheet targets a specific skill or comparison, giving teachers materials that work across a full statistics unit rather than only at a single moment in instruction.
The Specific Skills Each Worksheet Targets
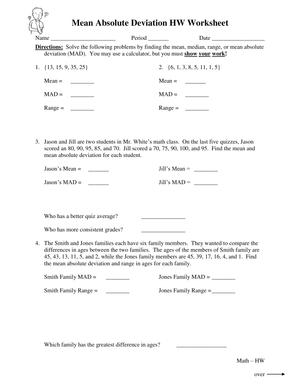
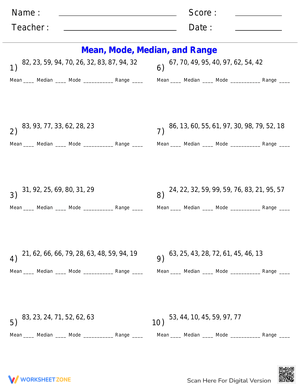
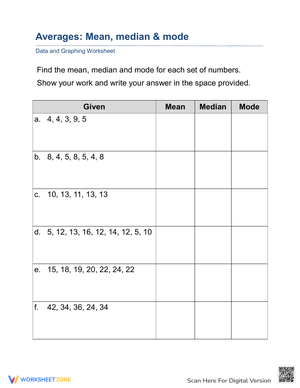
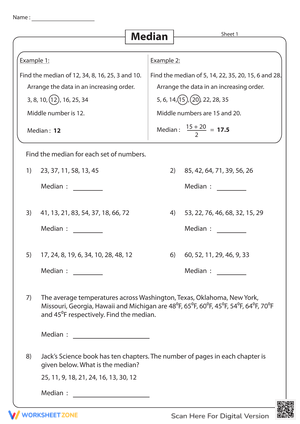
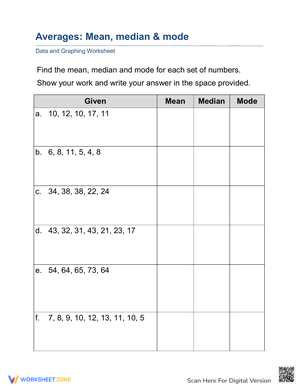
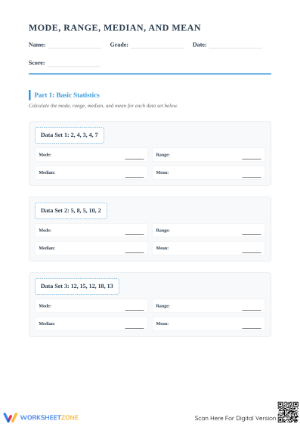
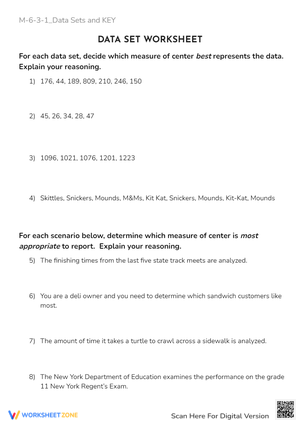
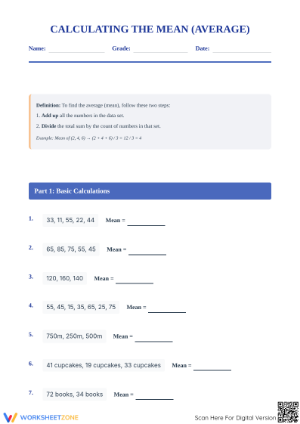
The set moves through three distinct phases. The first builds procedural accuracy: students compute the mean by summing values and dividing by the count, and they identify the mode in sets where one value clearly repeats. The second phase introduces unordered data sets, requiring students to sort values before locating the median — the step most students skip under time pressure. The third phase asks students to compare measures: given a set with one unusually high score, which measure gives a clearer picture of what's typical?
- Computing mean from whole-number and decimal data sets
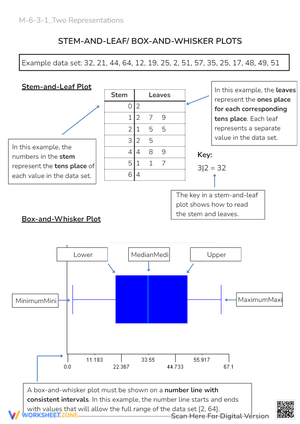
- Ordering values and finding the median, including even-count sets where the median falls between two numbers
- Identifying mode in sets with one mode, no mode, and two modes
- Recognizing how an outlier pulls the mean more than the median
- Writing brief explanations of which measure better represents a given data set and why
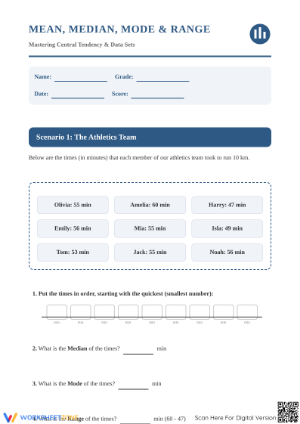
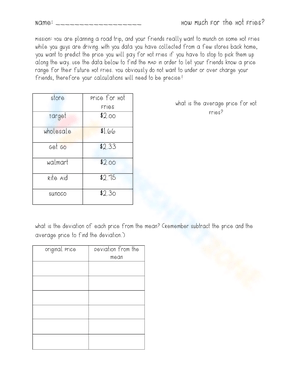
Contexts across the worksheets include quiz scores, weekly temperatures, and sports statistics — situations where sixth graders already have intuition about what a "typical" value should look like. That prior sense of reasonableness makes the analytical questions feel less abstract.
Frequent Errors Teachers Should Anticipate and Correct
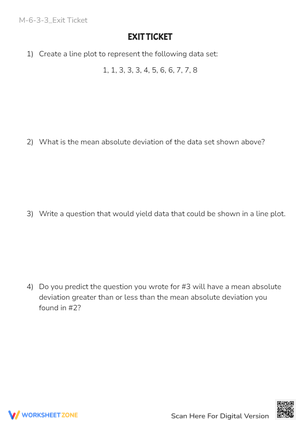
Three mistakes appear consistently enough in student work that they deserve targeted practice. The first is finding the median without ordering the data first. Given the set {12, 7, 19, 4, 10}, a student who does not reorder will often mark 19 as the median — it is the third value as written. Any worksheet that explicitly prompts students to rewrite values in ascending order before identifying the middle value catches this habit before a test surfaces it.
The second error involves dividing by the wrong number when computing the mean. A student who sums a five-value set and gets 45 will sometimes divide by 9 — one of the data values — rather than 5. This happens when students confuse the denominator's role: it counts the number of values in the set, it does not represent one of them. A labeled "number of values" box before the division step keeps that distinction visible while students are still building the skill.
The third is mode confusion in multimodal or no-mode sets. Students who learn that mode is "the most common number" often assume every set has exactly one. A set like {3, 5, 5, 7, 7, 9} stops many of them cold. The 6th grade mean median and mode worksheets in this collection include sets with no mode, one mode, and two modes in roughly equal proportion — so students encounter all three possibilities before a quiz or unit assessment exposes the gap.
Standard Alignment
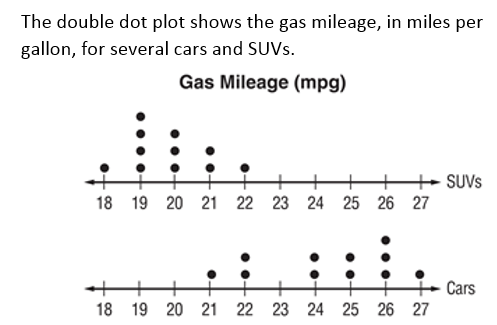
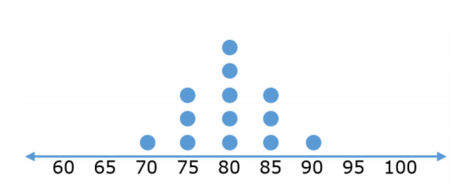
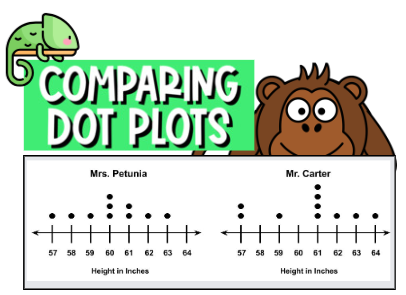
These worksheets address CCSS 6.SP.B.5c, which requires students to give quantitative measures of center — median and mean — and to relate their choice of measure to the shape and context of the data. In classroom terms, this standard sits in the second half of most sixth-grade statistics units, after students have worked with dot plots and histograms and are ready to describe distributions numerically. The short written-response prompts on several worksheets directly support the standard's expectation that students reason about their choice of measure rather than simply calculate it.
How to Work These Worksheets Into Your Lesson Plans
The most practical approach is to pull individual worksheets based on the lesson's target rather than assigning the full set at once. One worksheet works well as a Monday warm-up after students spent the previous week on visual data displays — it brings them back to numerical reasoning after a few days away from calculation. Another fits naturally as follow-up practice after a 15-minute mini-lesson where the teacher models finding the median in an even-count set, one of the procedural steps students consistently miscalculate the first time through.
For math centers, separating the set by skill type works better than mixing everything together. Computation worksheets go to the independent station; the comparison and interpretation worksheets belong at the teacher-led station where students can talk through their reasoning aloud. Exit tickets work well when pulled from the midpoint of a worksheet — one problem, clearly showing whether students can apply the day's target skill before dismissal. The 6th grade mean median and mode worksheets here include answer keys for every problem, which matters for peer-checking routines and center rotations that should not require the teacher to be present to verify answers.
Differentiating the Set Across Readiness Levels
For students who are still shaky on the procedures, reducing data set size matters more than simplifying the numbers themselves. A five-value set with whole numbers is far more manageable than a ten-value set, even when both use the same number range. Providing a structured sequence — a line to rewrite values in order, a box for the sum, a labeled division space — gives those students a visible process without changing what the worksheet is asking them to do.
On-level students benefit from worksheets that mix whole numbers with simple decimals (quiz averages like 87.5, temperatures like 64.2) and include at least one comparison question per worksheet rather than only direct computation. For students ready for more challenge, a missing-value task changes the demand entirely: "The mean of five values is 14. Four of the values are 10, 12, 16, and 18. What is the fifth?" That reversal requires students to genuinely understand the mean formula rather than apply it as a rote procedure. A cut-and-sort extension — matching data sets with their correct measures of center — works as a low-pressure option for students who finish early.
Frequently Asked Questions
Do these worksheets include even-count data sets for median practice?
Yes. Finding the median in an even-count set — where students must average the two middle values — is a distinct skill from the odd-count version, and students need practice with both. Each worksheet that targets median includes at least one even-count set alongside odd-count examples.
At what point in a unit do these worksheets fit best?
Most teachers introduce them two to three days into the statistics unit, once students have seen each measure modeled at least once during direct instruction. The earlier computation-focused worksheets work well in that first-practice window. The comparison and interpretation worksheets work better mid-unit or as review before a summative task.
How do these worksheets support students who are working below grade level?
Students who struggle with multi-step arithmetic find the most traction with the 6th grade mean median and mode worksheets that break mean calculation into clearly labeled steps — write the sum, write the number of values, then divide. That format keeps the statistical reasoning visible even when arithmetic fluency is still developing. Starting with small, whole-number sets and moving toward decimal sets across several sessions produces more reliable gains than assigning a full mixed-review worksheet from day one.
Do any worksheets address data sets with no mode?
Yes — and it is worth previewing this with students before they encounter it independently. A set like {2, 5, 8, 11, 14} has no repeating values and therefore no mode. Several worksheets include these sets explicitly, and the answer keys note "no mode" rather than leaving the line blank, which matters when students check their own work at a center or during partner review.