These 3rd grade data worksheets resources give teachers a ready set of bar graphs, pictographs, tally charts, and table tasks — formatted for printing and varied enough to carry instruction from Monday warm-up through Friday review. Third grade is when data work shifts from decoration to reasoning. Students move from counting bars to comparing categories, from recording a single total to explaining which group had 10 fewer, and from copying a finished graph to building one from raw classroom results. That shift takes deliberate, repeated practice, and this set is built around it.
The Specific Skills Students Build
A 3rd grade data worksheets collection that only addresses graph-reading leaves visible gaps by the end of the unit. Students need both directions: reading a representation handed to them and constructing one from scratch. Each worksheet targets one side of that clearly, so students aren't managing unfamiliar format demands at the same moment they're working through the math reasoning.
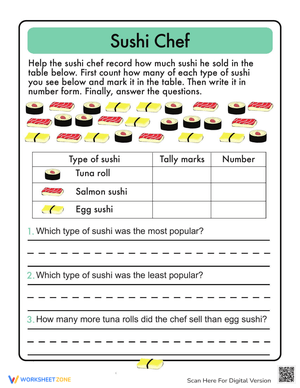
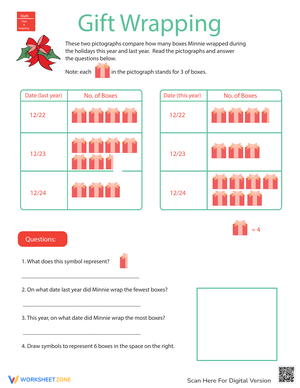
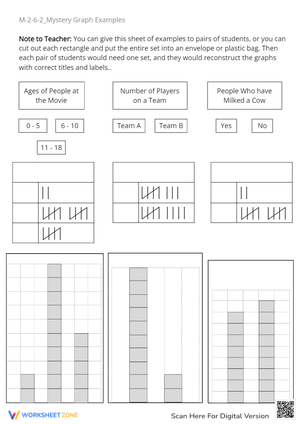
On the reading side, students count tally marks and convert them to totals, read bar graphs at scales of 1, 2, 5, and 10, apply pictograph keys where one symbol represents multiple items, answer comparison questions using subtraction, and find totals across categories. On the creating side, they transfer tallied results to a bar graph or pictograph, choose an appropriate scale for a given data range, and label titles, axes, and keys correctly. Both directions matter — a student who can read a scaled graph but can't build one from a tally sheet has only half the skill the standard requires.
Error Patterns That Show Up Reliably in Grade 3 Data Work
Pictograph worksheets surface a consistent miscounting problem. When the key assigns a value greater than 1 — say, 1 symbol equals 5 votes — students who understand the concept still lose track mid-count. You'll see answers off by exactly one symbol-value: a student reading 7 symbols on a scale of 5 might write 40 instead of 35, because they skip-counted correctly for the first six symbols and added an extra whole group on the last one. The correction isn't re-explaining the key — it's having students write the running total beneath each symbol as they go, so the miscount becomes visible before it transfers to the answer line.
Comparison questions trip students differently. When a worksheet asks how many more students chose soccer than basketball, students who haven't internalized the subtraction frame will add instead. They see two numbers mentioned in the same question and reach for the operation they've used most recently. Having students underline both bars, label each value, and write a subtraction sentence before computing slows this down in a way that rereading the question alone does not.
A third consistent problem: bars that fall between gridlines. Students round to the nearest labeled value rather than reading the interval. This is a visual estimation skill — not a counting skill — and it needs direct instruction before additional practice produces improvement.
Fitting These Worksheets Into the Teaching Week
The most efficient entry point is a whole-group projection on Monday. Display one bar graph worksheet, read the title and category labels aloud as a class, and ask students to predict what the data might show before revealing any answers. Then model annotating the scale — marking each interval, writing the value at each bar — before working through the questions together. That 12-minute opening routine gives students a framework they carry into every independent task later in the week.
For centers, place one worksheet at the station with colored pencils and a discussion prompt on a sticky note: "Which category surprised you, and why?" That prompt pushes the work beyond circling answers without adding significant writing overhead. For homework, choose bar graph worksheets with formats students already know so families can support the task without needing new directions. For quick formative checks, pull just the comparison and totaling questions rather than assigning the full worksheet — it saves five minutes and gives a clearer picture of who can actually interpret data versus who is copying steps.
Tally chart worksheets work especially well as pre-graph tasks. Students collect quick classroom data — how many classmates wore sneakers, sandals, or boots — fill in the tally chart, then transfer those results to a bar graph on a follow-up worksheet. That two-step sequence is where students begin treating graphs as a tool for organizing real information rather than as a drawing exercise. The 3rd grade data worksheets set includes enough tally and bar graph pairings that teachers can run this sequence several times across the unit without repeating the same topic.
Standard Alignment
These worksheets align to CCSS 3.MD.B.3, which requires third graders to draw scaled picture graphs and bar graphs representing data with several categories, and to solve one- and two-step problems using that data. The standard sits in the Measurement and Data domain and is typically introduced after students reach fluency with addition and subtraction within 1,000 — because the comparison questions embedded in scaled graph work depend on number sense that must already be stable. Most Grade 3 curriculum maps place 3.MD.B.3 in the second or third instructional unit. These worksheets fit that window as direct practice, formative checks, or mid-unit review tasks.
Making the Set Work for Every Level in the Room
The difficulty range across the worksheets is wide enough that teachers can tier assignments without creating anything new. The three levels sort naturally:
- Support: tally charts and bar graphs on a scale of 1, four categories or fewer, vocabulary pre-taught before the worksheet is distributed — students who stall at the directions rather than the math often know how to read the graph once the language is clear
- On level: scaled bar graphs, pictographs with keys of 2 or 5, one-step comparison and totaling questions
- Extension: pictographs with keys of 10 or 25, two-step word-problem worksheets, and a follow-up task where students examine a completed graph and write three questions of increasing difficulty
Reducing writing load is a practical adjustment across all levels. Ask students to circle answers first and then justify only one problem in full sentences. That keeps mathematical thinking visible without turning a graphing task into a writing assignment.
Frequently Asked Questions
What graph types are covered in the set?
The set includes bar graph worksheets, pictograph worksheets, tally chart worksheets, and table-to-graph worksheets. Formats range from bar graphs on a scale of 1 to scaled pictographs where one symbol represents 5, 10, or 25 items.
Do these print clearly in black and white?
Yes. Each worksheet is formatted for standard 8.5 × 11 paper and requires no color ink. Scales, keys, and category labels are all readable in grayscale, which matters for most classroom printing budgets.
How do these work for intervention without requiring a separate resource?
Sort by format rather than reteaching from scratch. Tally charts and basic bar graphs on a scale of 1 belong with intervention groups; scaled graphs and pictographs with on-level students; two-step word-problem worksheets with students who need a push. If you're searching for a 3rd grade data worksheets that moves from entry-level graph reading all the way to above-grade interpretation in a single download, this set covers that full range without requiring supplemental materials.